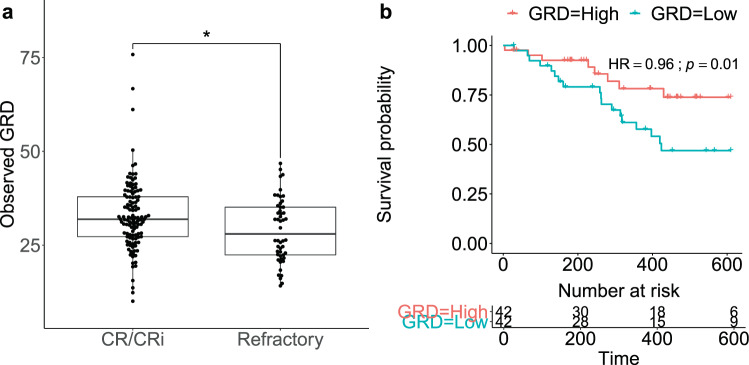
Fig. 2. Ex vivo general response across drugs is associated with clinical response and improved patient outcome.
a GRD in patients who achieve complete remission (CR) or complete remission with incomplete hematologic recovery (CRi) to standard induction chemotherapy (n = 118) versus those refractory to induction (n = 50) in OHSU dataset. *Wilcoxon rank-sum test p < 0.05. b Kaplan–Meier survival curves of patients in OHSU dataset with GRD above the upper quartile (red; “responders”; n = 42) and of those with GRD below the lower quartile (blue; “non-responders”; n = 42). Data are right censored at 610 days. HR: Cox proportional hazard ratio. a, b GRD is computed across drugs common to OHSU and FIMM datasets.

