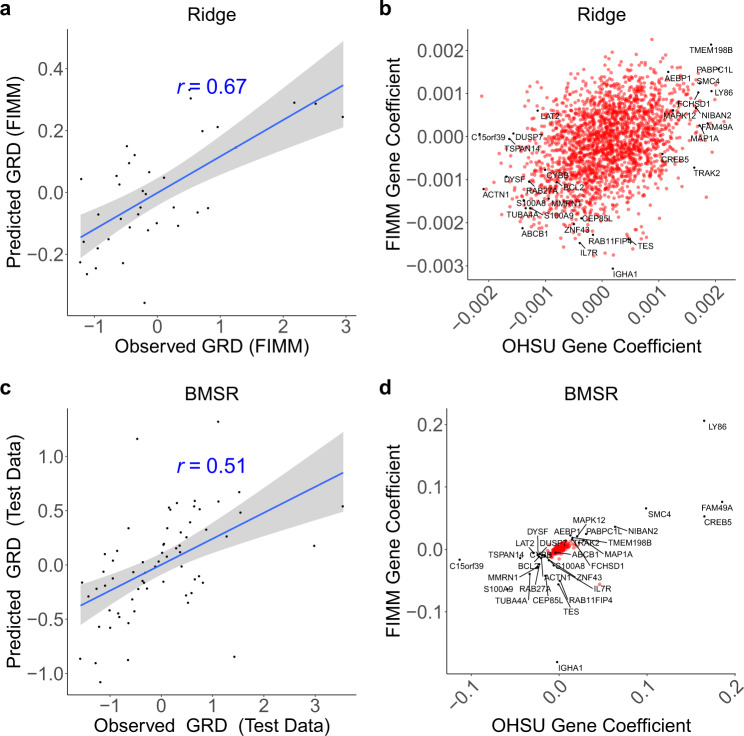
Fig. 3. Integrative analysis reveals growth-, apoptosis-, and drug efflux-associated biomarkers of general response across drugs.
a, c Observed (x axis) versus model-predicted (y axis) GRD. a Expression-based ridge regression model trained on OHSU samples (n = 292) and tested on FIMM samples (n = 37). c Expression-based Bayesian multi-source regression (BMSR) model trained using fivefold cross-validation on combined OHSU and FIMM datasets (n = 263) and tested on held-out fold yielding median performance across the fivefolds (n = 66). b, d Coefficients of genes (n = 2132) in OHSU (x axis) or FIMM (y axis) datasets following b training of ridge regression model independently on both datasets or d training of BMSR model simultaneously on entirety of both datasets (n = 329). GRD is computed across drugs common to OHSU and FIMM datasets. r: Pearson correlation; dashed line: identity line; blue line: linear regression fit; gray shading: 95% confidence interval. Labeled genes were those having extremal (Stouffer’s p < 0.01) combined coefficients across both datasets, as well as ABCB1 (i.e., MDR1).

