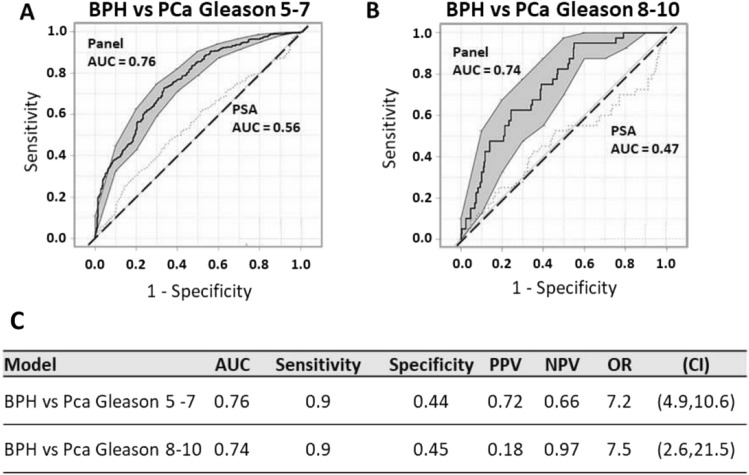
Figure 4.
Prostate Cancer Biomarker Panel Differentiates Lower Urinary Tract Symptoms/Benign Prostate Hyperplasia (LUTS/BPH) from Prostate Cancer (PCa) in Patients with Intermediate and High Gleason Score. (A) Receiver operator characteristics (ROC) curve for prostate cancer biomarker panel demonstrates better performance in differentiating patients with LUTS/BPH from PCa compared to PSA alone in patients with an intermediate Gleason score (5–7). Area under the curve (AUC) for the panel is 0.76 versus PSA alone 0.56. Shaded grey regions indicate standard error. (B) Receiver operator characteristics (ROC) curve for prostate cancer biomarker panel demonstrates better performance in differentiating patients with LUTS/BPH from PCa compared to PSA alone in patients with a high Gleason score (8–10). Area under the curve (AUC) for the panel is 0.74 versus PSA alone 0.47. Shaded grey regions indicate standard error. (C) Diagnostic performance (AUC), sensitivity, specificity, positive predictive value (PPV), negative predictive value (NPV), odds ratio (OR), and 95% confidence interval (CI) of the OR for each model.

