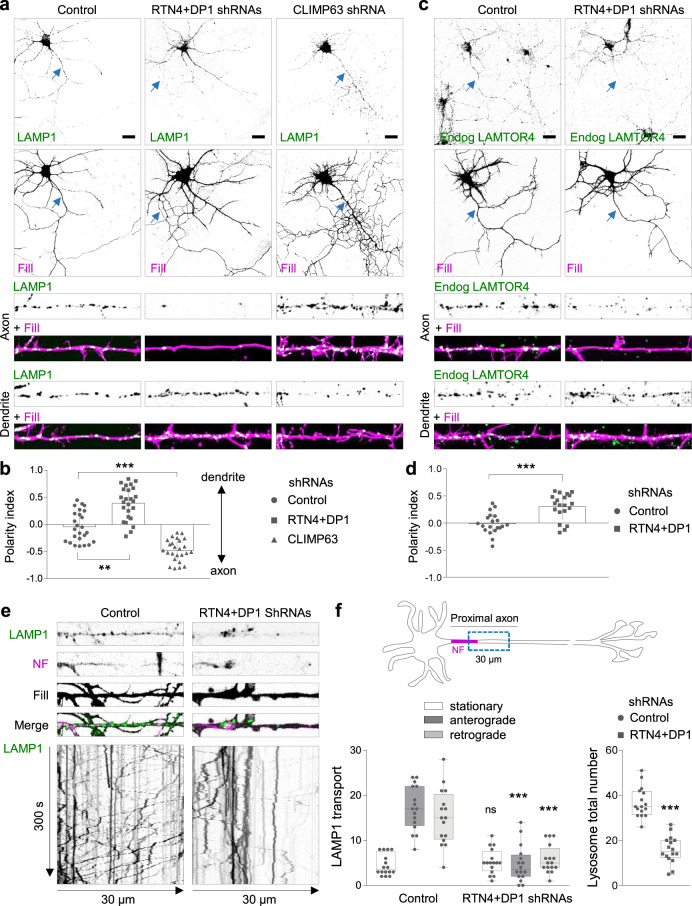
Fig. 1. ER morphology controls lysosome translocation into the axon.
a, b Representative images of DIV7 hippocampal neurons co-transfected at DIV3 with LAMP1-GFP (green), a mCherry fill (magenta) and a control pSuper plasmid or a pSuper plasmid containing a shRNA sequence targeting RTN4 plus DP1, or CLIMP63, in (a). Higher magnification of 40-μm straightened axon (top) or dendrite (bottom) segments. Quantification of LAMP1 polarity indices in (b) (n = 25 neurons per condition). See also Supplementary Fig. 2a–c, e–g, i, j. c, d Representative images of DIV7 neurons that were transfected with a mCherry fill (magenta) and a control pSuper plasmid or with shRNAs targeting RTN4 plus DP1 and stained with a LAMTOR4 antibody (green) in (c). Higher magnification of 40-μm straightened axon (top) or dendrite (bottom) segments. Polarity indices for LAMTOR4 in (d) (n = 20 neurons per condition). e Representative still images (top) and kymographs (bottom) from a 30-μm-segment of straightened proximal axons of live neurons co-transfected with LAMP1-GFP (green) and fill (gray) together with control pSuper or shRNAs targeting RTN4 plus DP1, and labeled for the axon initial segment (AIS) marker Neurofascin (NF; magenta) prior to imaging for 300 s. f Quantification of LAMP1-positive lysosome movement and total number of lysosomes from conditions as in (e); n = 16 per condition. Schematic representation of a neuron indicating the axon initial segment marker NF in magenta and the axonal region (blue dotted box) selected for quantification (top), average number of stationary, anterograde and retrograde pools (bottom, left) and average number of total lysosomes (bottom, right). Blue arrows point to the proximal axon and scale bars represent 20 µm in (a) and (c). Individual data points each represent a neuron in (b), (d) and (f). Data are presented as mean values ± SD in (b) and (d). Boxplots show 25/75-percentiles, the median, and whiskers represent min to max values in (f) (ns—not significant, **p < 0.01 and ***p < 0.001 comparing conditions to control (Kruskal–Wallis test followed by a Dunn’s multiple comparison test) in (b) and (one way ANOVA followed by a Sidak’s multiple comparison test) in (f left), and (two-sided unpaired t-test) in (d) and (f, right). Source data and exact p values are provided as a Source Data file. See also Supplementary Movies 1–3.

