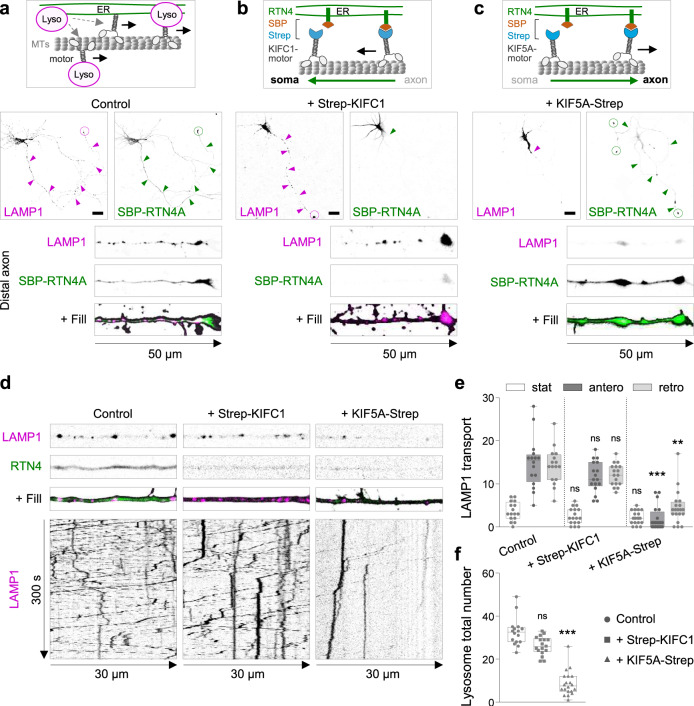
Fig. 2. Somatic ER tubules control lysosome translocation into the axon.
a Schematic model for motor-driven lysosome transport regulated by ER tubules (top). Representative images of LAMP1-RFP (magenta) and GFP-SBP-RTN4 (green) distribution in a control DIV6 neuron co-transfected with fill (middle), and higher magnification of distal axon (bottom). b Schematic representation of Streptavidin (Strep)-SBP heterodimerization system using SBP-RTN4 and Strep-KIFC1 for MT-dependent minus-end ER tubule transport and its persistent somatic retention (top). Representative images of LAMP1-RFP (magenta) and GFP-SBP-RTN4 (green) distribution in a neuron co-transfected with Strep-KIFC1 and fill (middle) and higher magnification of distal axon (bottom). c Schematic representation of Strep-SBP system using SBP-RTN4 and KIF5A-Strep for MT-dependent anterograde transport of ER tubules and its persistent distribution in distal axons (top). Representative images of LAMP1-RFP (magenta) and GFP-SBP-RTN4 (green) distribution in a neuron co-transfected with KIF5A-Strep and fill (middle) and higher magnification of distal axon (bottom). d, f Representative still images (top) and kymographs (bottom) from a proximal axon of live neurons co-transfected with LAMP1-RFP (magenta) and SBP-RTN4 (green), in absence of a motor protein (control; n = 16), or with Strep-KIFC1 (n = 17) or KIF5A-Strep (n = 20) (from left to right) in d. Quantification of stationary, anterograde and retrograde movement of lysosomes from conditions in (d), in (e). Quantification of average total number of lysosomes from conditions in (d), in (f). See also Supplementary Movie 4. Magenta and green arrows point to the abundance of LAMP1 and SBP-RTN4 along the axon and dashed circles point to their accumulation at axon tips. Scale bars represent 20 µm in (a–c). Images are representative of three independent experiments in (a–c). Boxplot shows 25/75-percentiles, the median, and the individual datapoints each represent a neuron. Whiskers represent min to max values; ns—not significant, ***p < 0.001 and **p < 0.01 comparing conditions to control (Kruskal–Wallis test followed by a Dunn’s multiple comparison test) in (e) and (f). Source data and exact p values are provided as a Source Data file. See also Supplementary Fig. 2b, d, h.

