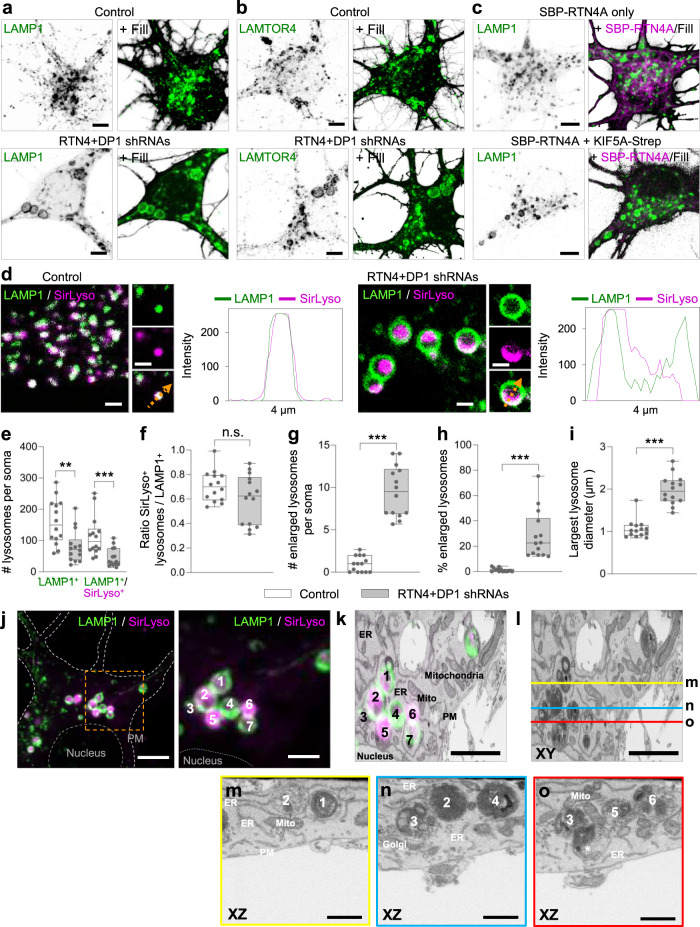
Fig. 3. ER tubule disruption causes enlargement and reduced motility of mature lysosomes.
a, b Representative images of lysosomes distributed in the soma of DIV7 neurons transfected at DIV3 with fill and a control pSuper plasmid (top) or pSuper plasmids containing shRNAs targeting RTN4 plus DP1 (bottom) together with LAMP1-GFP (a) or stained for endogenous LAMTOR4 (b), green in merges. See also Supplementary Fig. 3a and Supplementary Movie 5. Images are representative of three independent experiments. c Representative images of lysosomes in the soma of DIV6 neurons co-transfected at DIV5 with LAMP1 (green) and fill, together with only SBP-RTN4 (magenta) as a control (top) or SBP-RTN4 plus KIF5A-Strep (bottom) to pull ER tubules into the axon. See also Supplementary Fig. 3b–f and Supplementary Movie 6. Images are representative of three independent experiments. d Representative still images of the soma of DIV7 neurons transfected as in (a) and labeled live for active cathepsin-D (magenta) with SirLyso. LAMP1 in green. The size of LAMP1-positive lysosomes and luminal distribution of cathepsin content is shown. Intensity profile line on the right of magnified image of a lysosome for each condition. See also Supplementary Fig. 3g–k and Supplementary Movie 7. e–i Parameters indicated in each graph were quantified from the soma of neurons transfected and labeled as in (d). pSuper control (n = 14), white bars; RTN4 plus DP1 knockdown (n = 14), gray bars. Boxplots show 25/75-percentiles, the median, and individual datapoints each represent a neuron. Whiskers represent min to max values; ns—not significant, ***p < 0.001 and **p < 0.01 comparing conditions to control (two-sided Mann–Whitney U) in (e–i). j–o Correlative light electron microscopy (CLEM) of enlarged lysosomes. (j) FM image of a fixed neuron, knockdown for RTN4 and DP1 and expressing LAMP1-GFP. SirLyso indicates hydrolase active lysosomes. Nucleus and plasma membrane (PM) are indicated with dashed lines. A cluster of enlarged lysosomes was selected (orange rectangle representing the ROI) for 3D-EM analyses. The right panel shows an enlargement of the ROI with seven marked lysosomes. k Reconstructed FIB. SEM slice of ROI in same (XY) orientation as FM and with overlay of FM signal. l Same EM image as in (k) marked with yellow, blue, and red lines that correspond to the orthogonal images shown below. m XZ plane image corresponding to the yellow line in (l) and showing cross sections of lysosomes #1 and #2. Lysosome #2 shows many intraluminal vesicles in this plane corresponding to the SirLyso signal in the FM image. n XZ plane image corresponding to the blue line in (l) and showing cross sections of lysosomes #2 and #4. In contrast to (m), lysosome #2 contains dense degraded material in this plane, showing the compartmentalized content of these enlarged lysosomes. Lysosome #3 and #4 are closely interacting. o XZ plane image corresponding to the red line in l showing lysosomes #3, #5 and #6. An additional lysosome (*) tightly in contact with lysosome #3 is seen in EM but not visible in the FM image. Many interactions between lysosomes were observed, but they remained separate entities. PM, Golgi, ER and mitochondria present in the EM ROI, are indicated in (k), (m–o). CLEM images are representative of three correlated samples. Scale bars represent 5 µm in (a–c), (j), 2 µm in (d), (j, right panel), (k) and (l), and 1 µm in (m–o). Source data and exact p values are provided as a Source Data file. See also Supplementary Fig. 3l.

