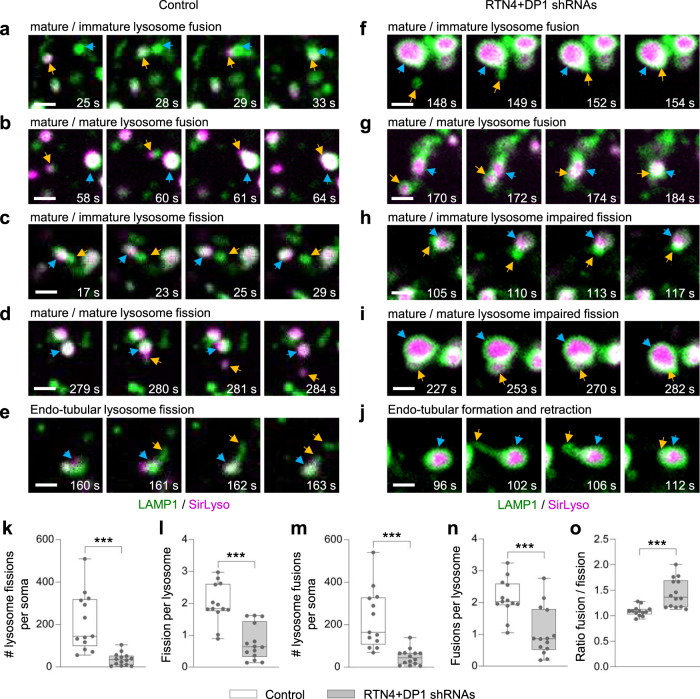
Fig. 4. Enlarged lysosomes are caused by an imbalance in homo-fission.
a–j Representative still images of fusion and fission events from DIV7 neurons co-transfected with control pSuper (a–e) or shRNAs targeting RTN4 plus DP1 (f–j) together with LAMP1-GFP (green) and labeled with SirLyso (magenta) prior imaging for 300 s every 1 s. Fusion between lysosomes in (a, b, f, g); Fission in (c–e); impaired fission in (h–j). Time scale included per event. Blue and orange arrows point to two lysosome undergoing fusion, or one lysosome budding from a parent lysosome. In all images, scale bars represent 1 µm. See also Supplementary Fig. 4a–h and Supplementary Movie 8. k–o Parameters indicated in each graph were quantified from live neurons transfected and labeled as in (a–j) and imaged for 300 s every 1 s. pSuper control (n = 13), white bars and RTN4 plus DP1 knockdown (n = 14), gray bars. Boxplots show 25/75-percentiles, the median, and individual datapoints each represent a neuron. Whiskers represent min to max; ns—not significant, ***p < 0.001 and **p < 0.01 comparing conditions to control (two-sided Mann–Whitney U (k–o). Source data and exact p values are provided as a Source Data file.

