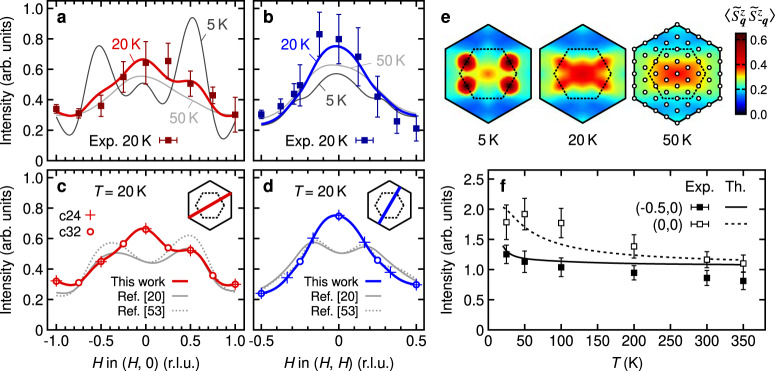
Fig. 5. Theoretical RIXS intensity and pseudospin correlations in the Kitaev–Heisenberg model.
a, b Momentum dependence of the theoretical RIXS intensity calculated at T = 5 K (dashed), 20 K (solid blue), and 50 K (solid cyan), using the pseudospin Hamiltonian [Eq. (1)]. To obtain the best fit to the experimental data (squares), the exchange parameters K = −5, J = −3, Γ = 2.5, and J3 = 0.75 meV were used. c, d Comparison of the RIXS intensity computed with different parameter sets. The optimal theoretical curve is compared with those for the parameter sets proposed in refs. 20 and 53. The insets show the q paths. The points represent results at the accessible q vectors for the 24-site cluster (crosses) and 32-site cluster (circles) that were used to construct the smooth profiles. e Temperature evolution of the equal-time pseudospin correlation function for the optimal parameter set. The maps were calculated for the 32-site cluster with the accessible q vectors (circles) marked on the 50 K map. f Temperature dependence of the RIXS intensity at q = (0, 0) and (−0.5, 0). The data points were collected with the azimuthal angle of ϕ = 0 [the geometry for the (H, 0) path]. The lines show the theoretical curves obtained by a simulation for the 24-site cluster.

