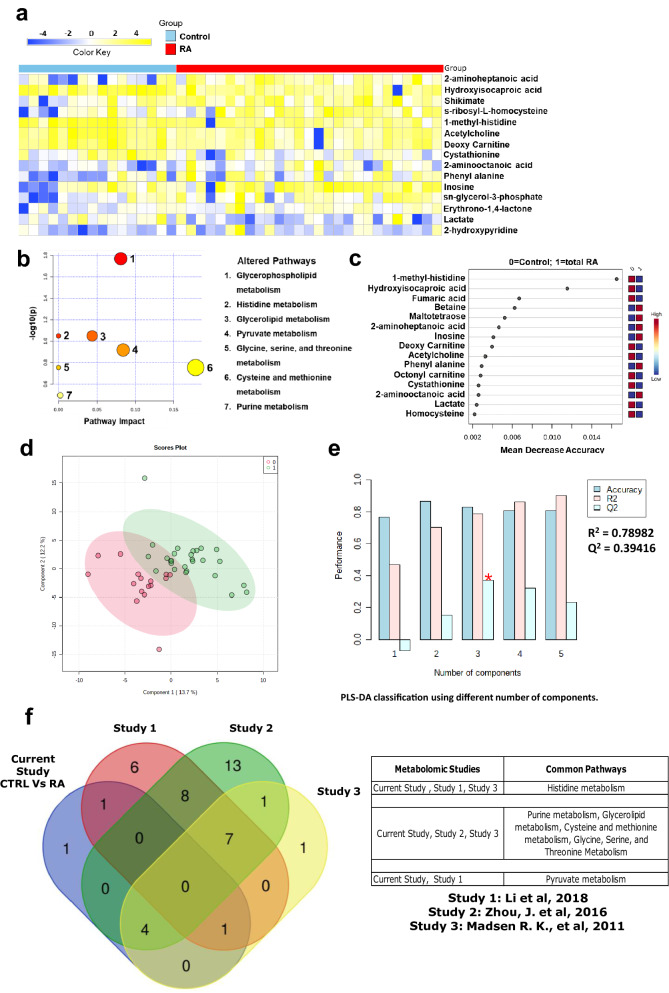
Figure 2.
Targeted metabolomics data showing altered metabolic signatures in RA patients compared to healthy controls. (a) Heat map showing the relative levels of 15 significantly altered metabolites at FDR 0.25 with shades of yellow and blue representing the elevated and reduced metabolite levels, respectively (heatmaps were made in Microsoft Excel). (b) Pathway analysis showing altered metabolic pathways in RA patients compared to healthy controls. Size of the circle represents the impact of each pathway and with color representing level of significance (highest in red to lowest in yellow). (c) Ranking of significant metabolites based on random forest analysis for their ability to stratify RA patients from healthy controls (ranked by the mean decrease in classication accuracy when they are permuted). (d) PLS-DA clustering given by score plot (0 = Control, 1 = RA) and (e) cross validation of PLS-DA of RA patients with healthy controls (red star indicates the best classifier based on accuracy, R2, and Q2 values). (Figures b, c, d, and e were generated using the web-based tool Metaboanalyst https://www.metaboanalyst.ca/). (f) Overlapping pathways between our serum metabolomics data of RA patients with three independent published serum metabolomics datasets of RA patients. (Venn Diagram was created using an online tool http://bioinformatics.psb.ugent.be/webtools/Venn/).

