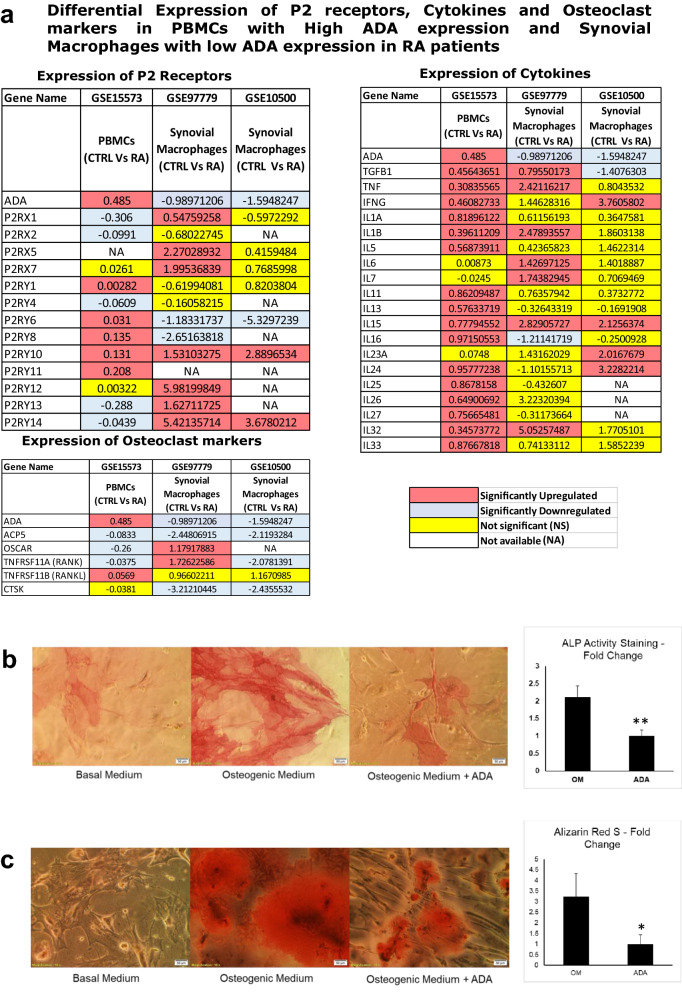
Figure 7.
(a) Comparative transcriptomics data analysis of High and Low ADA expression datasets showing differential gene expression of P2 receptors, inflammatory cytokines and osteoclast markers in PBMCs and synovial macrophages respectively. (b) ADA treated MSCs in osteogenic medium showed significantly reduced differentiation to osteoblasts compared to those treated with osteogenic medium alone as evident from ALP staining (OM = Osteogenic Medium; ADA = Osteogenic medium with ADA). (c) Alizarin Red S staining shows reduced mineralization in osteoblasts differentiated from MSCs in the osteogenic medium with ADA compared to osteogenic medium alone (OM = Osteogenic Medium; ADA = Osteogenic medium with ADA). (showing *representing a p value of ≤ 0.05, and **representing a p value of ≤ 0.005). All the plots were made using Origin 2020.

