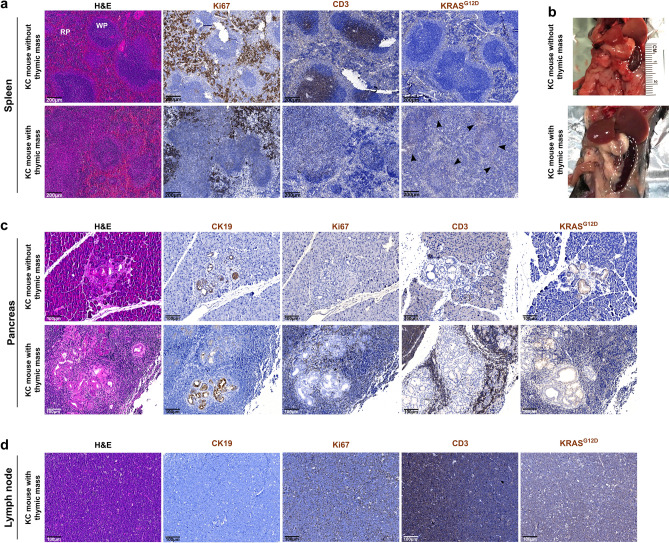
Figure 5.
Immune dysregulation in mice suffering from thymic lymphoma development. (a) Representative images of histological analysis of spleen from KC mice presenting or not thymic mass (H&E staining and Ki67 and KRASG12D immunohistochemistry). (b) Image showing enlarged spleen from KC mouse with thymic mass. (c) Representative images of histological analysis of the pancreas of KC mouse without thymic lymphoma, and one of the two mice with thymic mass which presented high level of immune infiltration (H&E staining and CK19, Ki67, CD3e and KRASG12D immunolabelings). (d) Representative images of histological analysis of the proximal lymph node of one of the two mice with thymic mass which presented high level of immune infiltration (H&E staining and CK19, Ki67, CD3e and KRASG12D immunolabelings). Scale bars are indicated on the pictures.

