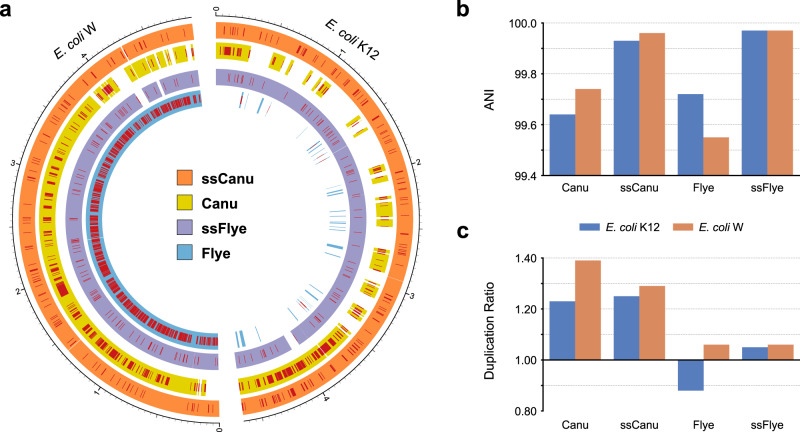
Fig. 2. Mock3 dataset assembly statistics.
a Circos58 graph displaying the coverage and SNV-rich regions (single-nucleotide errors) of the strain-oblivious assemblies (Flye and Canu) and their strain-separated counterparts obtained with Strainberry (ssFlye and ssCanu, respectively) compared to the reference sequences of the two E. coli strains present. The external graduated scales reflect the genomic positions of the corresponding reference genomes. b Average nucleotide identity (ANI) and c duplication ratio of assemblies.

