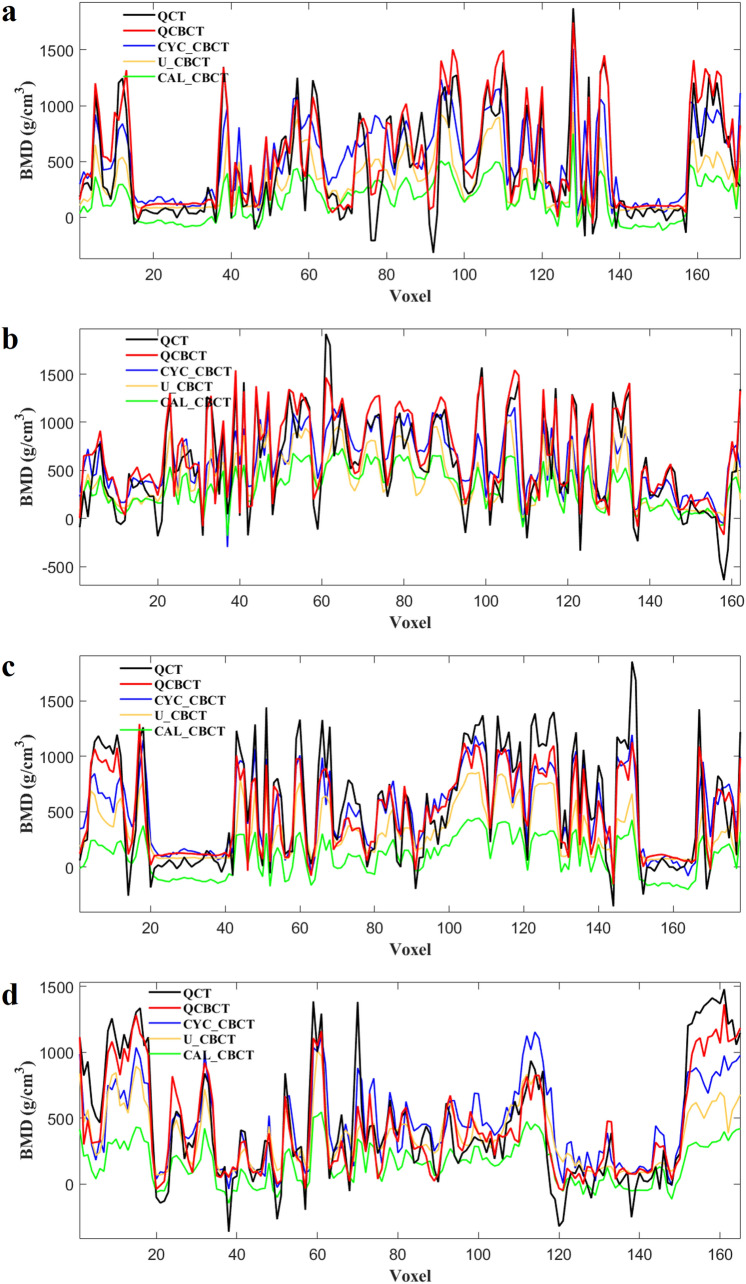
Figure 4.
The BMD (voxel intensity) profiles along the dental arch at the maxilla and the mandible in the QCT, and QCBCT, CYC_CBCT, U_CBCT, and CAL_CBCT images shown in Fig. 2. Pearson correlation coefficients of QCBCT, CYC_CBCT, U_CBCT, and CAL_CBCT with the original QCT were (a) 0.92, 0.65, 0.60, and 0.65, respectively, for the profile at the maxilla and, (b) 0.93, 0.70, 0.65, and 0.69, respectively, for the profile at the mandible shown in Fig. 2b, and (c) 0.92, 0.89, 0.84, and 0.88, respectively, for the profile at the maxilla, and (d) 0.93, 0.81, 0.82, and 0.82, respectively, for the profile at the mandible shown in Fig. 2c.

