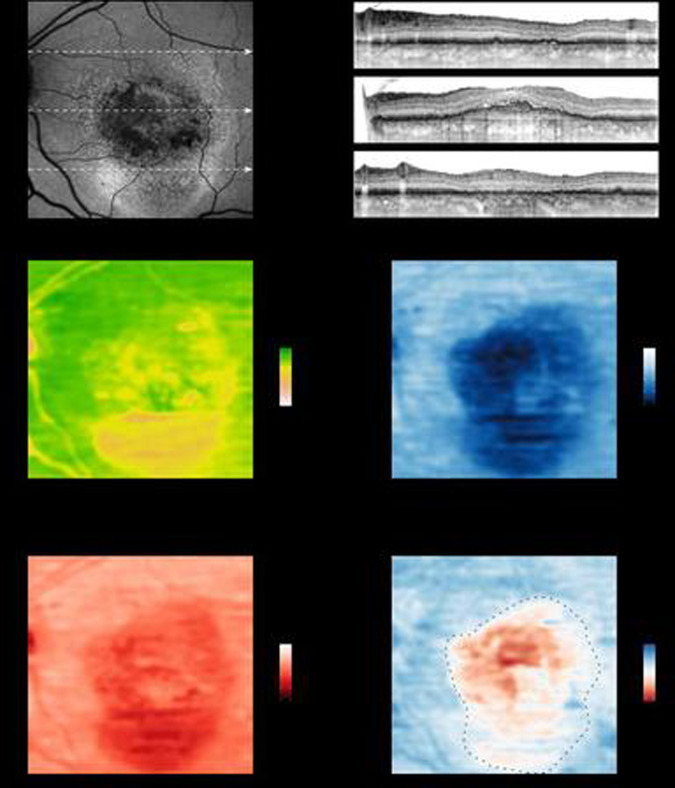
Fig. 1. Inferred sensitivity mapping.
Based on the fundus autofluorescence (FAF), infrared reflection (IR, not shown) and spectral-domain optical coherence tomography (SD-OCT), mesopic as well as dark-adapted (DA) cyan and DA red sensitivity may be reliably inferred and topographically mapped. The arrows in the FAF image indicate the position of the SD-OCT B-scans. Multiple lines of evidence further support the accuracy of the inference. For all three types of testing, angioscotoma are adequately predicted. Further, the central rod-free zone is also correctly inferred as indicated by the marked cyan-red sensitivity difference at the fovea (eccentricity of 0°, middle B-scan). Regions exhibiting increased FAF and absence of photoreceptor outer and inner-segments (upper and lower SD-OCT scan) show reduced function for all three types of testing. Yet globally the degree of DA cyan dysfunction appears to exceed the degree of DA red dysfunction. Please note, that the inferred cyan-red sensitivity difference in the region of severe cone dysfunction (delimited by the dashed line) is an underestimation of the true cyan-red sensitivity difference due to the floor effects of the perimetry device used in this study that are inevitable reflected by the models. (Reprinted from von der Emde et. al: Artificial intelligence for morphology-based function prediction in neovascular age-related macular degeneration; Scientific reports 9:1132; published [2019] Springer Nature).

