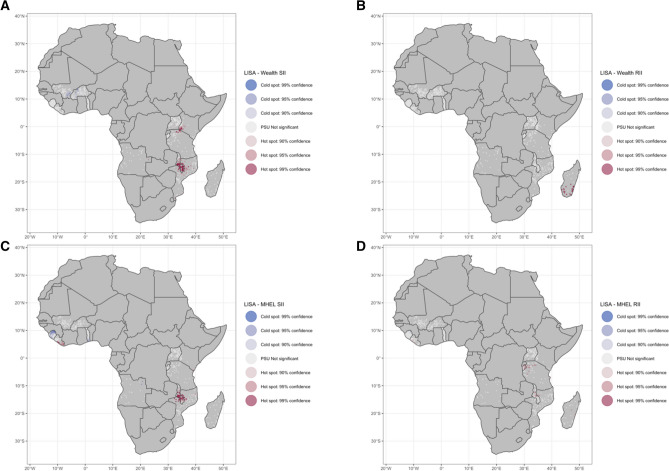
Figure 3.
Local spatial autocorrelation of malaria inequality as Local Getis-Ord Gi* at the Primary Sampling Unit (PSU) level. Malaria inequality relative to wealth index (WI) in the (A) absolute and (B) relative scales, and relative to mothers’ highest educational level (MHEL) in the (C) absolute and (D) relative scales. The maps were generated using R software v.4.0.1 (R: A language and environment for statistical computing, R Core Team, R Foundation for Statistical Computing, Vienna, Australia (2021) http://www.R-project.org/) with ggplot2 3.3.2 (H. Wickham. ggplot2: Elegant Graphics for Data Analysis. Springer-Verlag New York, 2016.) and country boundaries from Natural Earth (https://www.naturalearthdata.com/) using the package spData 0.3.1 (https://nowosad.github.io/spData).

