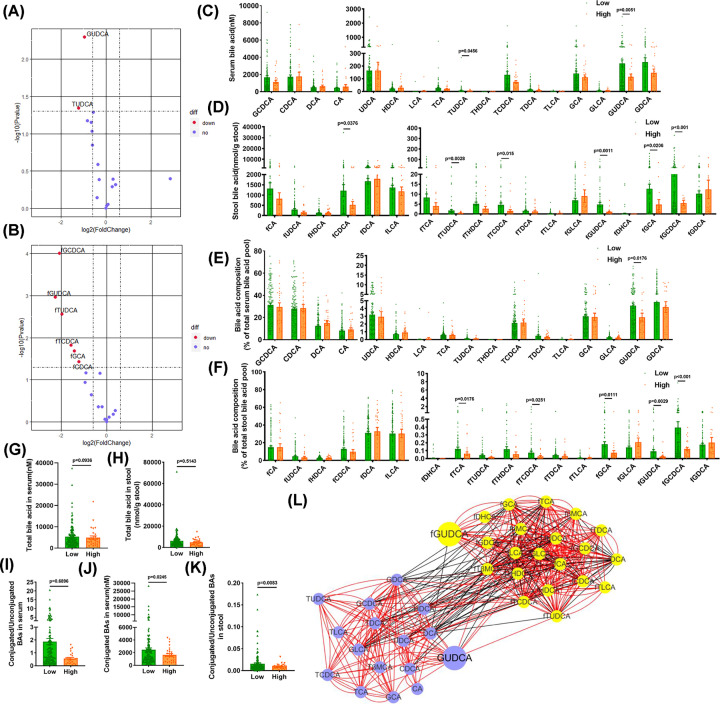
Figure 1. Changes of bile acid metabolism in patients with glucose metabolic disorders.
Collected patients in our metabolic cohort, stool and serum samples were obtained. (A) Volcano plot of bile acids in the serum (High vs. Low group). (B) Volcano plot of bile acids in the stool (High vs. Low group). (C) Levels of bile acids in the serum samples. (D) Levels of bile acids in the stool samples. (E) Composition of bile acids in serum. (F) Composition of bile acids in stool. (G) Total bile acid levels in serum samples. (H) Total bile acid levels in stool samples. (I) Ratios of conjugated to unconjugated bile acids in serum. (J) The level of conjugated bile acids in serum. (K) Ratios of conjugated to unconjugated bile acids in stool. (L) Correlation network of bile acids in the serum and feces. Purple means serum bile acids, yellow means fecal bile acids. Using Spearman correlation coefficient, red edges means r > 0, black edges means r < 0, all presented edges’ P are under 0.05 (n=135 for Low group, n=28 for High group). Data are shown as the mean ± SEM and analyzed by Welch’s t test.

