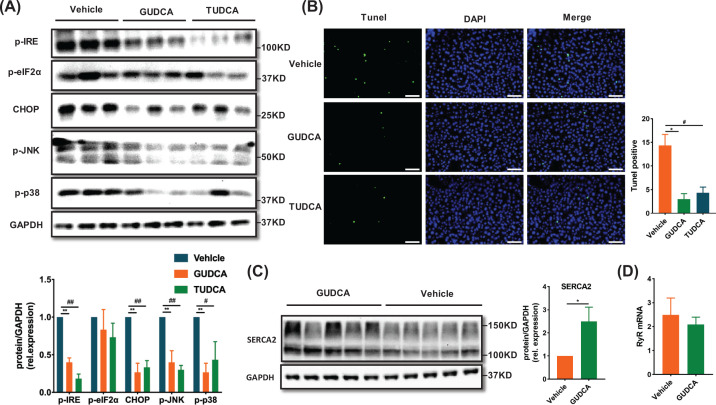
Figure 8. GUDCA attenuates HFD-induced ER stress activation and apoptosis in liver.
(A) Western blot analysis of p-IRE, p-eIF2α, CHOP, p-JNK and p-p38 protein expression in livers and the statistical graph (n = 3/group). (B) Representative staining of the livers with TUNEL in mice; scale bars: 100 µm. (C) Representative immunoblot of SERCA2. (D) Quantitative real-time PCR measurement of RyR in mice (n = 5-8/group). All data are presented as the mean ± SEM and analyzed by one-way ANOVA followed by the Bonferroni post hoc test for (A) and (B), two-tailed unpaired Student’s t test for (C) and (D). *P<0.05, **P<0.01 GUDCA versus vehicle; #P<0.05, ##P<0.01 TUDCA versus vehicle.

