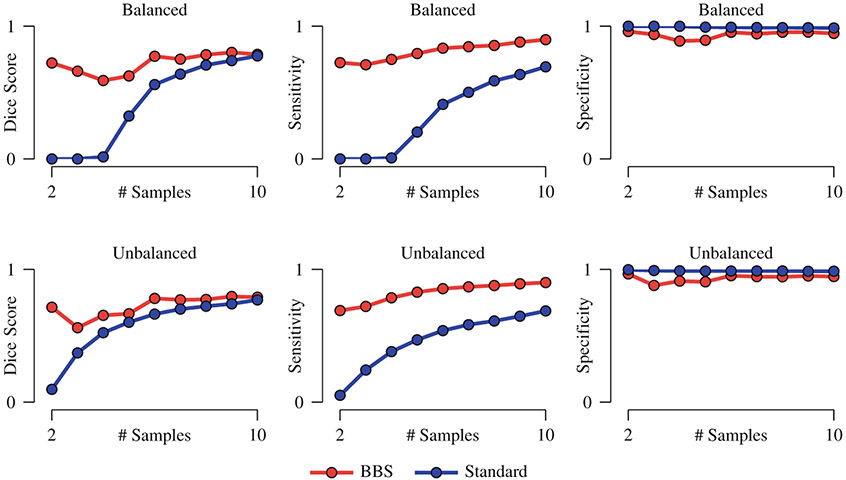
Fig. 3. Performance Statistics.
Detection accuracy, sensitivity, and specificity of BBS compared with the standard permutation test. The mean values of 10 repetitions are shown. The standard deviations are negligible and are not displayed. For the case of balanced sample size, both groups have the same number of samples. For the case of unbalanced sample size, only the size of the patient dataset was varied; the size of the normal control dataset was fixed at 10.

