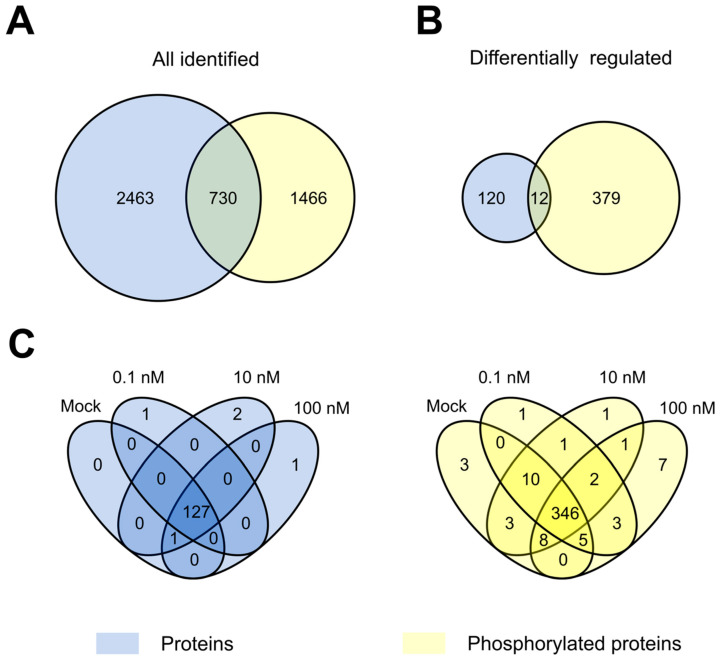
Figure 2.
Comparison of NAA proteome and phosphoproteome data. (A,B) Overlap of all identified and differentially regulated proteins (blue; 3193 protein groups) and phosphoproteins (yellow; 6548 phosphosites mapped to 2196 proteins) in proteome and phosphoproteome datasets. (C) Overlap between differentially regulated (including “unique” ones) proteins (blue) or phosphoproteins (yellow) at different NAA concentrations.

