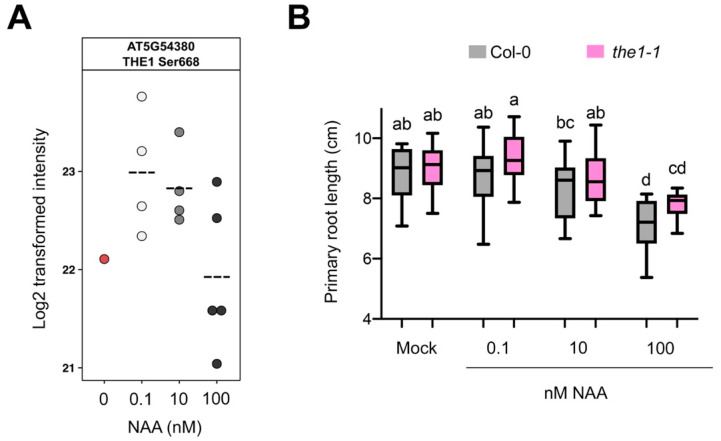
Figure 3.
THE1 impacts NAA-controlled primary root growth. (A) THE1 phosphoprofile for the TGPSLDQT(0.007)HVS(0.959)T(0.034)AVK phosphopeptide upon NAA treatment. Dashed line indicates mean. Each dot is a biological replicate. (B) Primary root growth of 11-day-old the1-1 seedlings in response to different concentrations (n = 18–30 seedlings). Boxplots show average with Tukey-based whiskers. Letters indicate significant difference according to two-way ANOVA with Tukey post-hoc test (p < 0.05).

