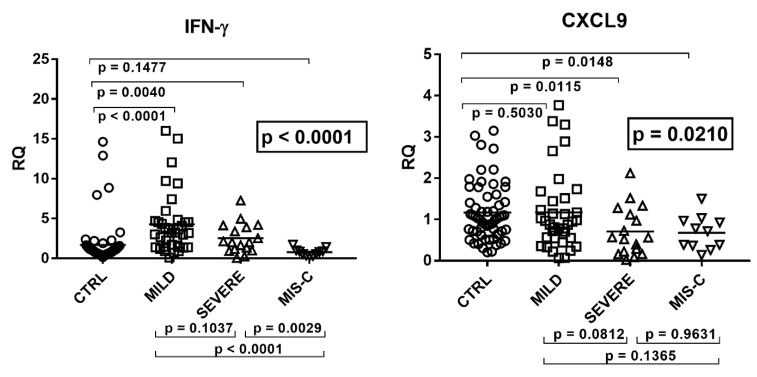
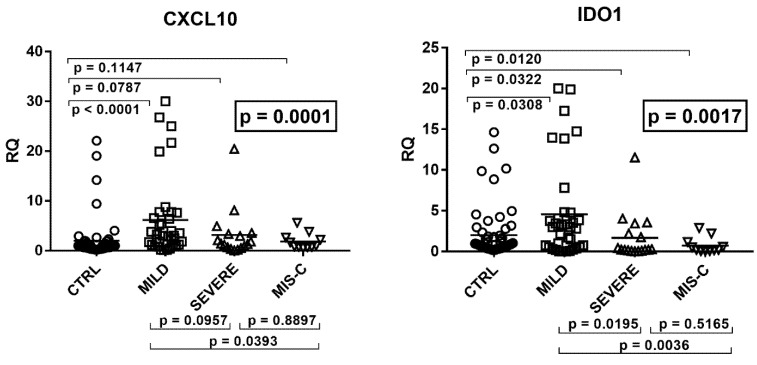
Figure 2.
Expression of type II interferon and of CXCL9, CXCL10, and IDO1 in whole blood from 64 children with SARS-CoV-2 infection and 60 uninfected children. CTRL: uninfected control children. MILD: infected children with mild/moderate symptoms. Severe: infected children with severe disease. MIS-C: infected children with multisystem inflammatory syndrome. RQ: relative quantification. Circles, squares, and triangles show the mean of three individual measurements, horizontal lines the median values. Median values–interquartile range (IQR) of IFN-γ and its sensitive genes: IFN-γ: CTRL: median 0.98, IQR 0.56, 1.37; MILD: median 3.23, IQR 1.45, 4.59; SEVERE: median 2.02, IQR 1.17, 3.92; MIS-C: median 0.80, IQR 0.44, 0.93. CXCL9: CTRL: median 1.03, IQR 0.71, 1.58; MILD: median 0.91, IQR 0.55, 1.46; SEVERE: median 0.56, IQR 0.22, 1.12; MIS-C: median 0.71, IQR 0.37, 0.95. CXCL10: CTRL: median 0.78, IQR 0.51, 1.32; MILD: median 3.00, IQR 1.21, 6.82; SEVERE: median 1.41, IQR 0.67, 3.35; MIS-C: median 0.94, IQR 0.75, 2.40. IDO1: CTRL: median 0.82, IQR 0.43, 1.80; MILD: median 3.00, IQR 0.56, 4.23; SEVERE: median 0.24, IQR 0.15, 2.20; MIS-C: median 0.21, IQR 0.10, 0.86. Statistical analysis: one-way ANOVA was used to compare the transcriptional levels of each target between the four groups of children. The Mann–Whitney test was used to compare the transcriptional levels of each target between each group of children with each other.


