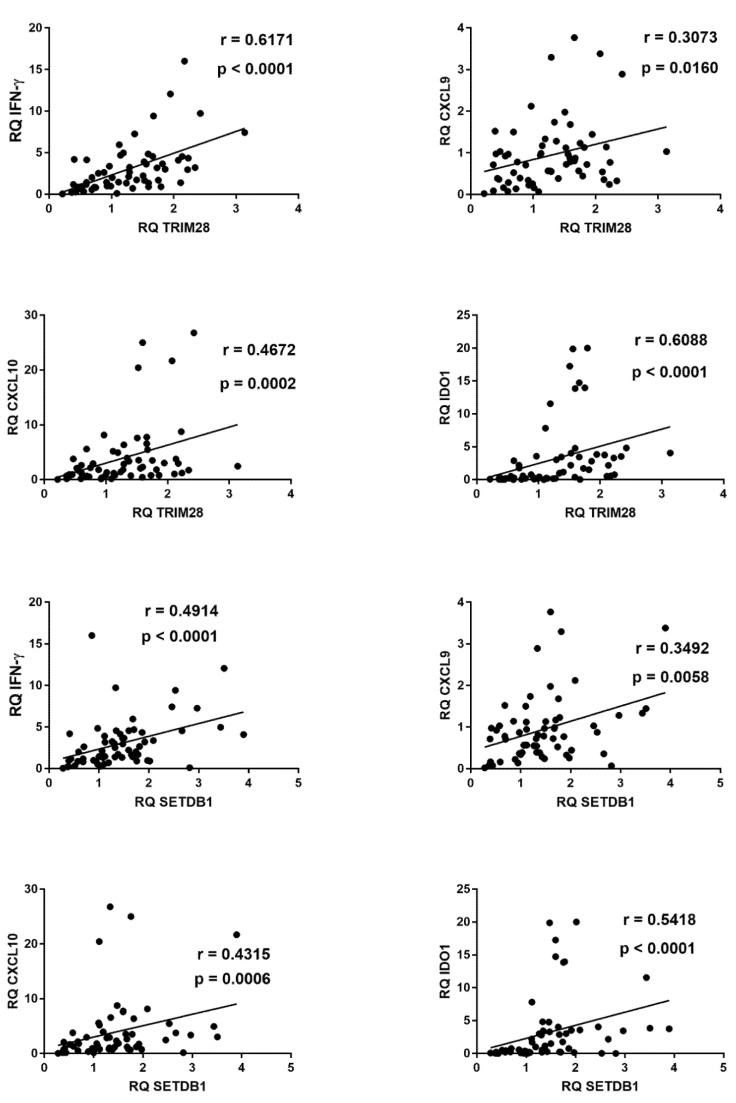
Figure 7.
Correlations between transcription levels of type II IFN and its sensitive genes and TRIM28 or SETDB1 in whole blood from 64 COVID-19 children. RQ: relative quantification. Circles show the mean of three individual measurements. Line: linear regression line. Statistical analysis: Spearman correlation test.

