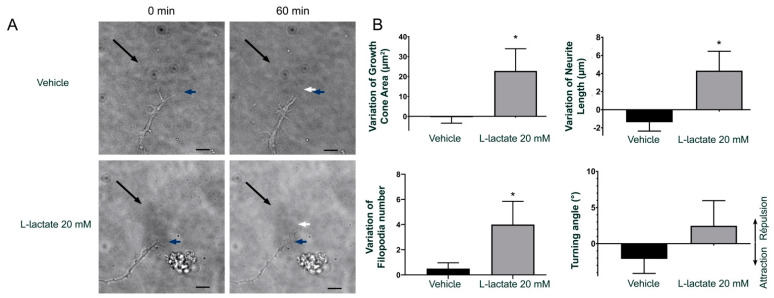
Figure 3.
L-lactate influences GC morphology and axon growth, but not turning. (A) Time-lapse microscopy time of a DIV1-2 mouse RGC growth cone before and at 60 min after the addition of L-lactate. The black arrows indicate the microgradient direction created by a micropipette with a tip of 2 µm diameter and positioned at a 45° angle and around 100 µm distal to the growth cone. The blue arrows indicate the tips of the growth cone before the application of L-lactate or vehicle (T0). The white arrows indicate the position of the growth cone 60 min later (T60). (B) Analysis of growth cone dynamics. The values of the growth cone area, filopodia number on the growth cone, axon length, and the angle of the growth within the L-lactate microgradient were measured before (T0) and at 60 min (T60) after the addition of L-lactate or vehicle. Bar graphs show the means ± SEM of the effects induced by the treatments (n = 6–8 cells per condition). * Indicates significant changes compared to the vehicle group, compared by parametric unpaired t-test (p < 0.05). Scale bar = 15 µm.

