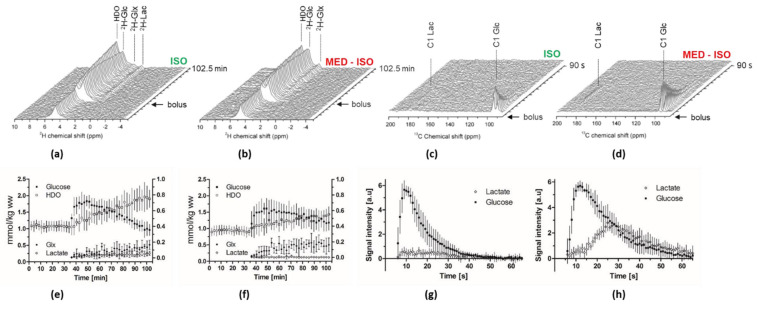
Figure 2.
(a,b) Characteristic dynamic spectra measured in the mouse head under the two different anesthetic protocols. (‘ISO’ or ‘MED–ISO’) following infusion of non-HP [6,6′-2H2]Glc and the corresponding time courses of water (HDO), Glc (2H-Glc), glutamate–glutamine (2H-Glx) and lactate (2H-Lac) shown for each group (e,f) respectively, mean ± SD. HDO and Glc refer to the left y-axis while Glx and Lac refer to the right y-axis. (c,d) Characteristic spectra measured in the mouse head under the two different anesthetic following infusion of HP [2H7, U-13C6] Glc and the corresponding time courses of [1-13C] Lactate and [1-13C]glucose shown for each group (g,h), mean ± SD; glucose signal normalized to 6, arbitrary units).

