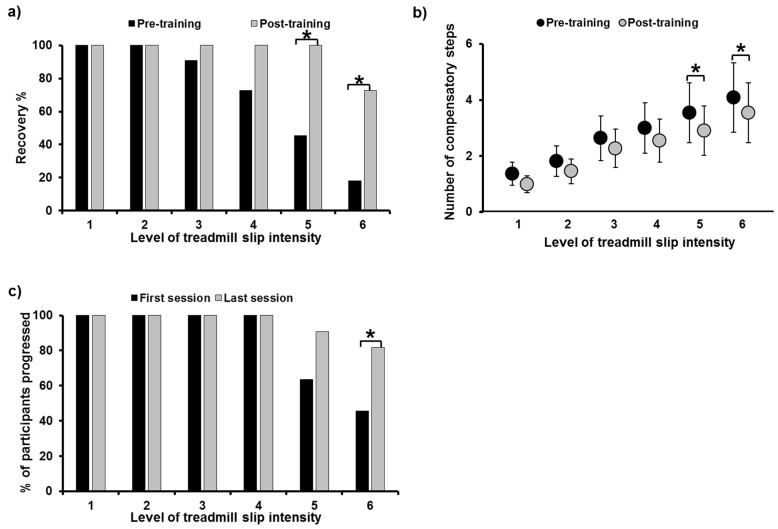
Figure 3.
Figure showing (a) percentage of recovery and (b) number of compensatory steps taken post-perturbation on all six intensities of treadmill-based gait-slips (L1 to L6), comparing pre- and post-training. Figure (c) shows the percentage of participants who were able to progress to higher training intensities in the last training session compared to the first training session. *: Significant differences (p ≤ 0.05).

