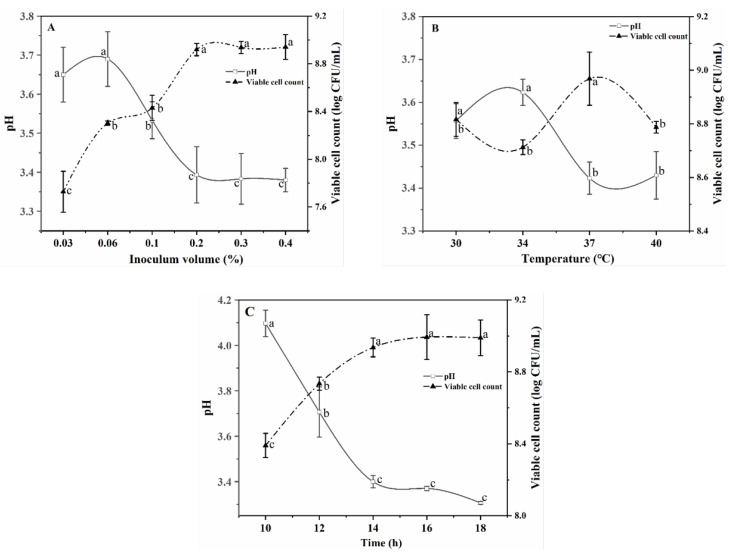
Figure 1.
Changes in pH values and viable cell counts under different inoculation volumes (A) (0.03%, 0.06%, 0.10%, 0.20%, 0.30%, and 0.40% with separate trials at 37 °C and fermented for 14 h), fermentation temperatures (B) (30 °C, 34 °C, 37 °C, and 40 °C with separate trials with 0.30% inoculation volume and fermented for 14 h), and fermentation time periods (C) (10 h, 12 h, 14 h, 16 h, and 18 h with consecutive trials under different time points with 0.30% inoculation volume and fermented at 37 °C) with L. plantarum TUST-232. a,b,c Statistical analysis ANOVA at 95% confidence level, with different letters indicating a significant difference at p < 0.05.

