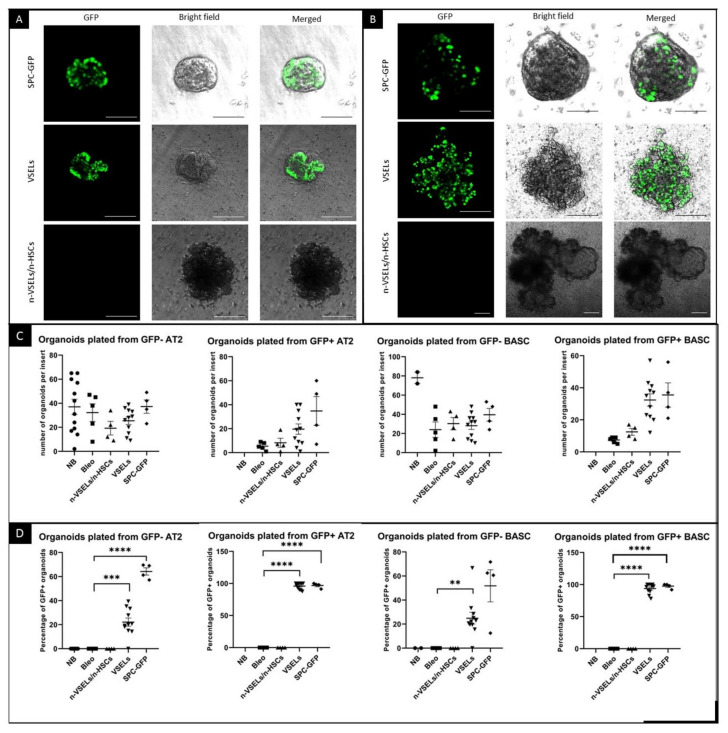
Figure 6.
Endogenous GFP fluorescence in organoids and quantification of cultured organoids. Photographs of unstained organoids established from sorted AT2 cells (A) and BASCs (B) isolated from SPC-GFP donor mice as well as VSEL and non-VSEL/non-HSC recipients as indicated. Photographed organoids are in tissue culture inserts, and green signal is from endogenous GFP. Each image shows an overlay of brightfield and GFP images from the same field of view. Scale bars represent 100 µm in Panel A and two upper rows of Panel B. Scale bars in bottom row of Panel B represent 200 µm. Quantification was done before organoids were removed from inserts for sectioning. Panel C. Graphs showing number of organoids grown for each mouse. Panel D. Graphs show percentage of organoids with endogenous GFP signal for each mouse. ** p < 0.01, *** p < 0.05 **** p < 0.0001.

