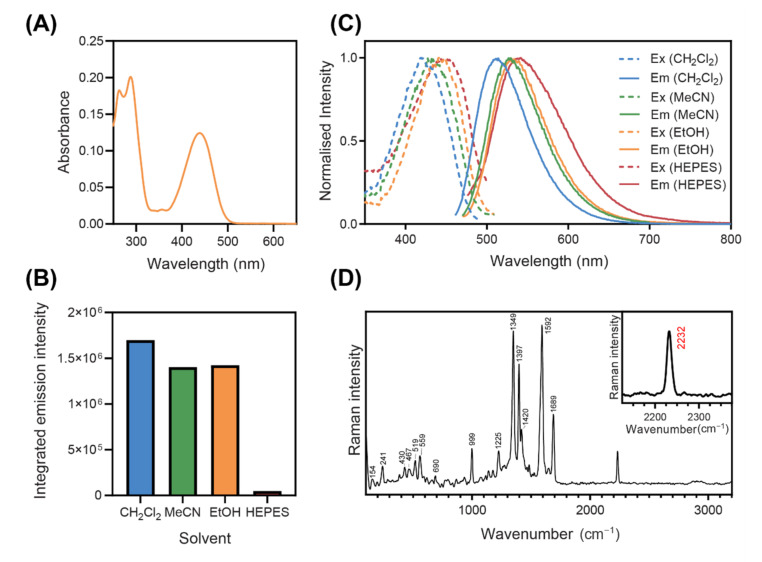
Figure 2.
(A) Absorbance spectrum of NpCN1 (10 µM) in absolute ethanol. (B) Normalised fluorescence excitation and emission spectra and (C) integrated fluorescence emission intensity of NpCN1 (10 µM) in a variety of solvents; ex = excitation, em = emission, CH2Cl2 = dichloromethane, MeCN = acetonitrile, EtOH = ethanol. (D) Raman spectrum of NpCN1, in the solid state, taken with the 50X and 785 nm laser excitation; inset shows the 2232 cm−1 C≡N band tracked in this study.

