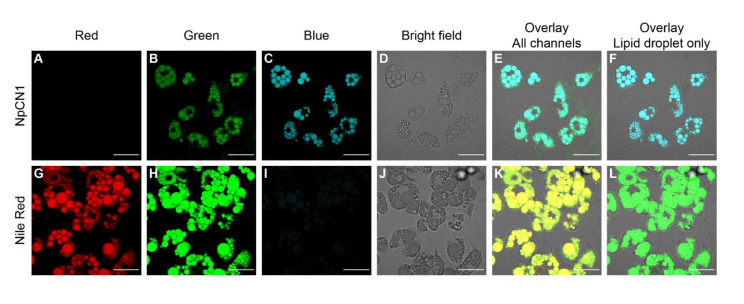
Figure 3.
Confocal microscopy images of live 3T3-L1 adipocytes treated with (A–F) NpCN1 (20 μM, 4 h) or (G–L) Nile Red (10 μM, 4 h). Live cells were imaged in (A,G) red (λex = 561 nm, λem = 570–670 nm), (B,H) green (λex = 488 nm, λem = 500–600 nm) and (C,I) blue (λex = 405 nm, λem = 450–550 nm) channels, along with (D,J) bright field images. (E,K) shows the overlay of all channels; (F) shows the overlay of C and D, (L) shows the overlay of H and K. The scale bar on all images represents 50 μm.

