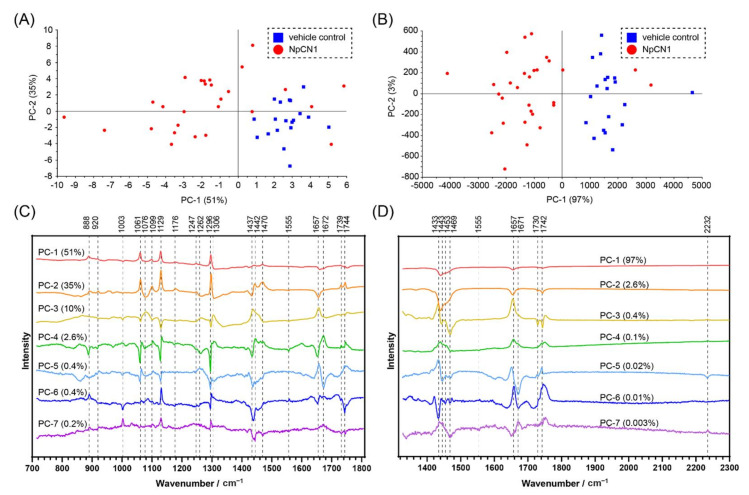
Figure 6.
PCA of the average spectra of individual 3T3-L1 cells dosed with NpCN1 (20 μM, 4 h) or equivalent volume DMSO as a vehicle control. Scores plots of the spectra from (A) 715 to 1806 cm−1 and (B) 1327 to 2304 cm−1 show a separation of the populations of cells. (C,D) show the loadings of the scores plotted in (A,B), respectively, along with the contribution of each PC.

