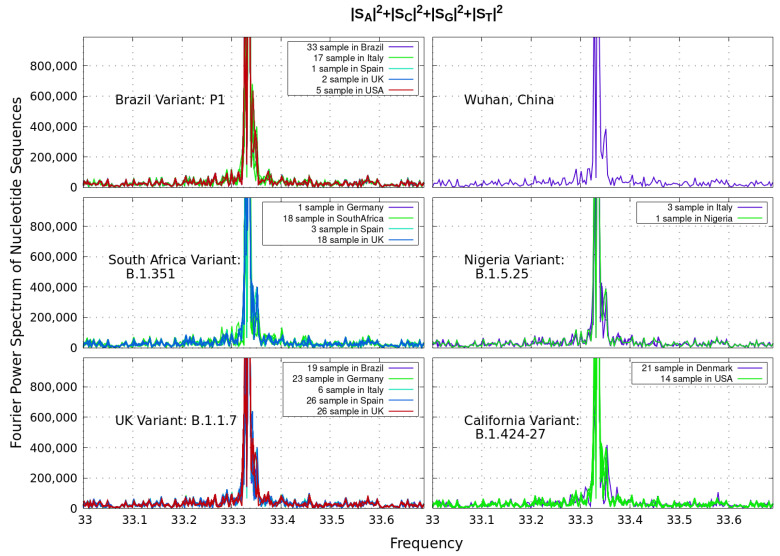
Figure 2.
Discrete Fourier Transform identifying base periodicity property of the coronavirus sequence. The plots reveal a distinct peak above noise level at around ‘frequency’ for all variants considered. The differences shown in brackets for a given country correspond to data from a given variant.

