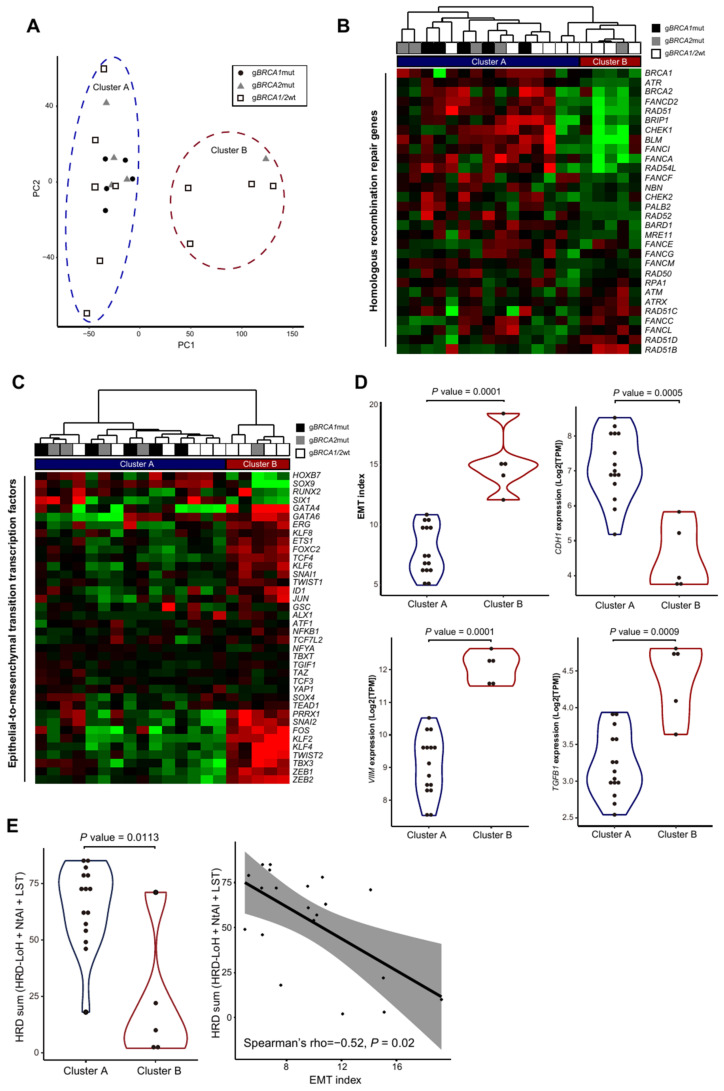
Figure 3.
Two distinctive patterns of molecular subtype identified through RNA-seq data analysis. (A) Transcriptional landscape of HGSOC samples through principal component analysis. Samples are represented by different shapes and colors by their origin and grouped according to K-means clustering with k = 2 (cluster A and cluster B). (B) Hierarchical clustering of samples represents the expression profile of 30 HRR genes. (C) Hierarchical clustering of samples with the expression profile of 38 EMT-TFs reproduced the result from the PCA analysis. (D) Violin plots showing difference in EMT index and gene expressions of CDH1, VIM, and TGFB1 between cluster A and cluster B. Each p value was calculated via Mann–Whitney U test. (E) A violin plot-view of HRD score distribution between cluster A and cluster B (left), and relationship between EMT-index and HRD sum scores (right). HRD scores between cluster A and cluster B were compared using Mann–Whitney U test. Statistical dependence between EMT index and HRD scores were computed through Spearman’s rank correlation coefficients. LoH, NtAI, and LST stand for loss of heterozygosity, number of telomeric allelic imbalances, and large-scale transition, respectively.

