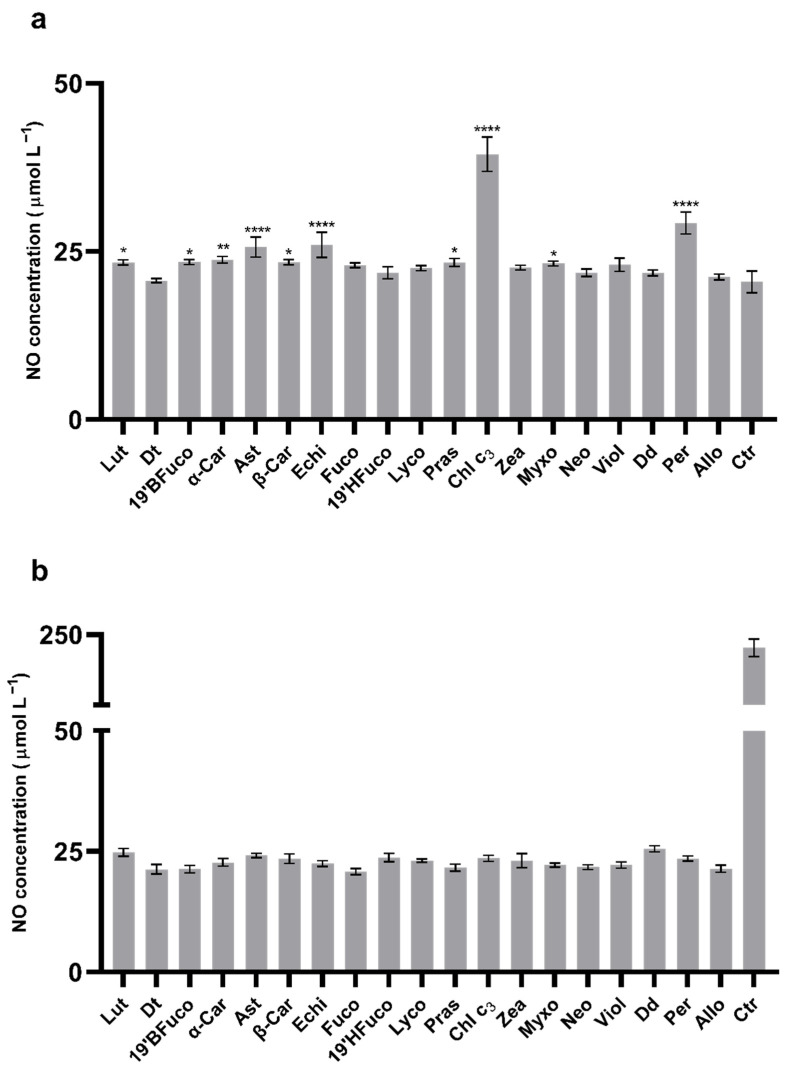
Figure 3.
Extracellular NO measurements. (a) B16-F0 extracellular NO concentration without UV-radiations. Asterisks indicate the statistically significant differences compared to the control (23 μmol L−1; no pigment; **** p-value ≤ 0.0001, ** p-value ≤ 0.01, * p-value ≤ 0.05; Dunnett’s test). (b) B16-F0 extracellular NO concentration after 15 min UV-radiations. All pigments showed significant differences compared to the control (no pigments with UV exposure, p-value ≤ 0.0001; Dunnet’s test). All values are expressed as mean ± SD of NO μmol L−1. Ctr: control.

