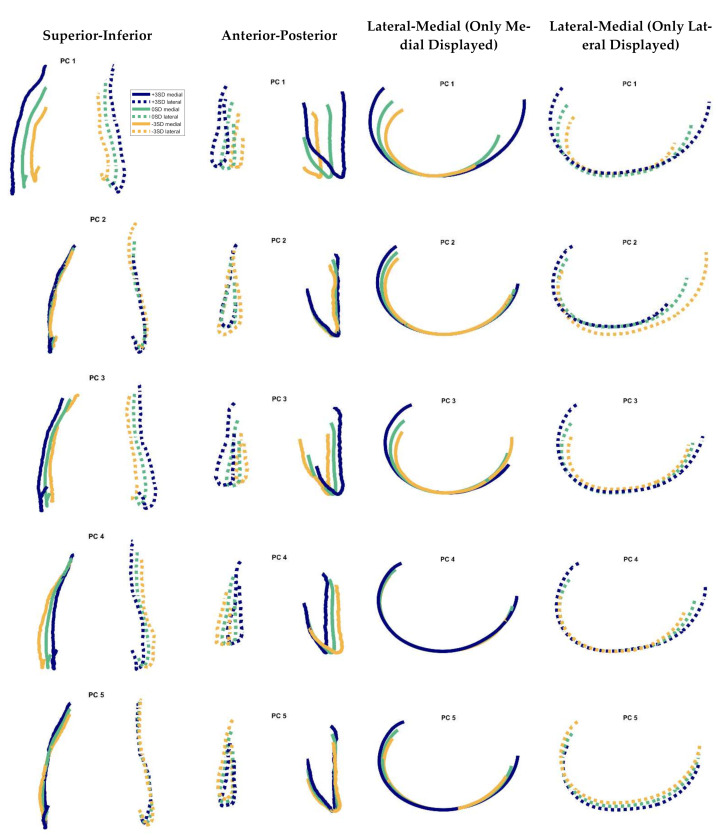
Figure 5.
Modes 1–5 of the cadavers’ 3D J-Curves in different views. Solid line: medial, dashed line: lateral. 3SD = 3 standard deviations. All contours were oriented to their most distal point in proximodistal direction, for better comparison of the respective variance. Variation explained by the modes 1–5: 31.5, 23.4, 20.1, 7.4, and 5.5%, respectively.

