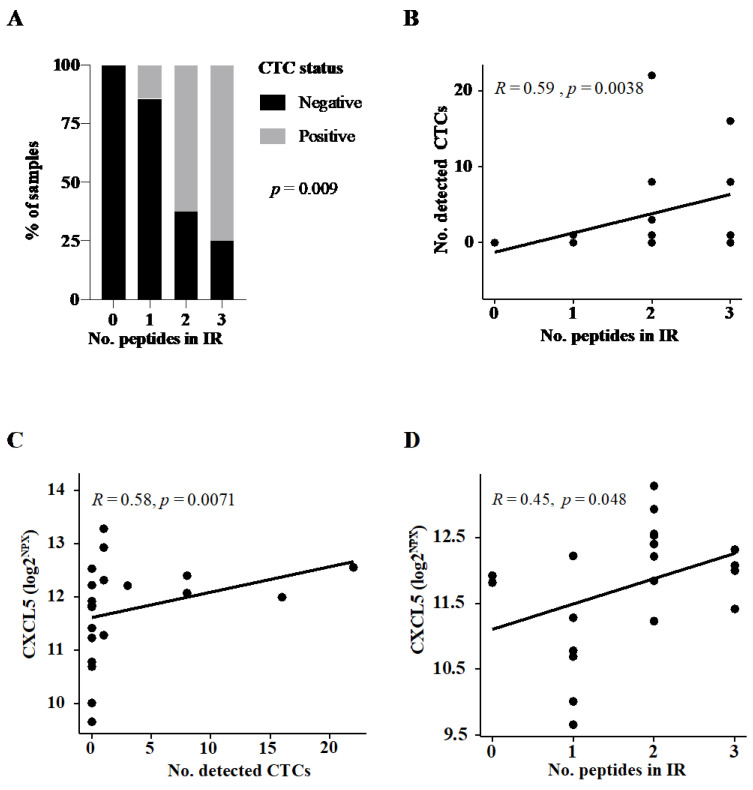
Figure 2.
Assessment of association between circulating tumor cell (CTC) status, immune response, and serum proteins in cohort 1. (A) Percentage of CTC-positive patients according to the number of reactive UV1®vaccine peptides in immune response (IR). p-value reported on Chi-square test. Dot plot to assess the distribution of (B) the number detected CTCs according to the number of reactive peptides in immune response (IR) in vaccinated patients, (C) serum levels of CXCL5 across the number of CTCs detected, and (D) CXCL5 according to the number of reactive peptides in IR. Correlation coefficient and p-values are reported on the Spearman rank test (B–D).

