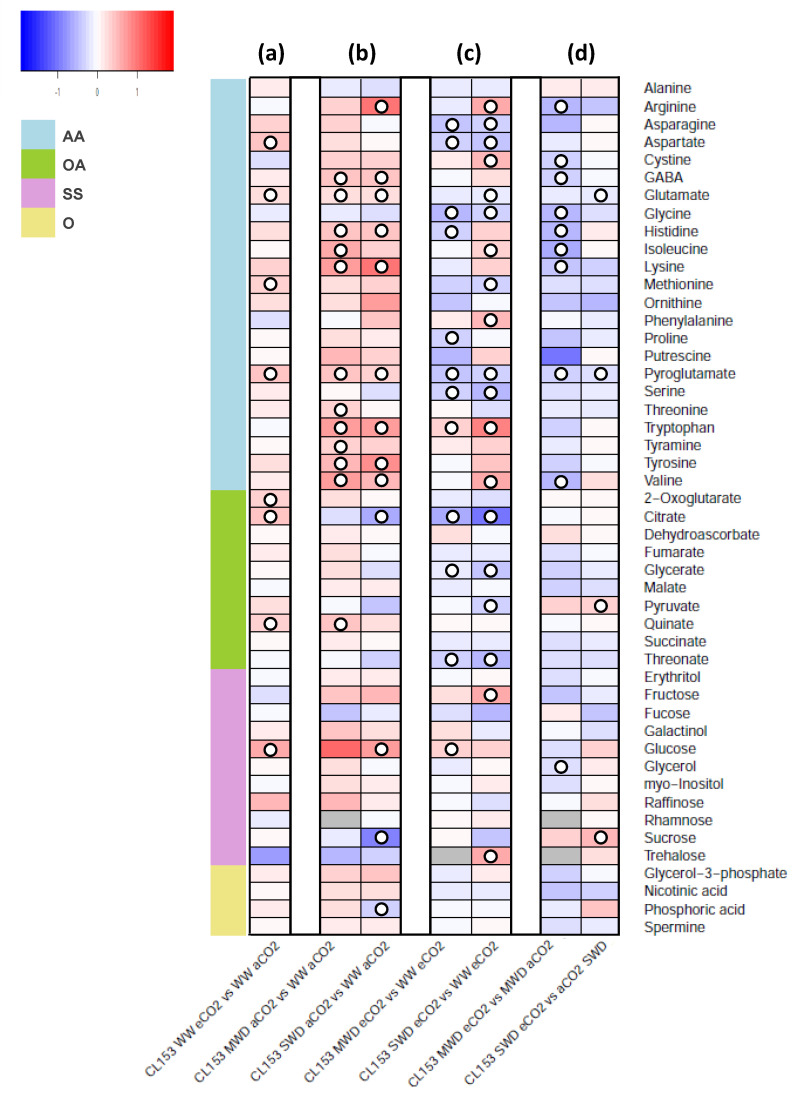
Figure 1.
Heatmap representing the changes in relative levels of primary metabolites in leaves of C. canephora cv. Conilon Clone 153 (CL153), grown under 380 (aCO2) or 700 (eCO2) ppm CO2, and three water availability levels (WW, well-watered; MWD, moderate water deficit; SWD, severe water deficit). Results indicate (a) single exposure to eCO2, (b) single exposure to each water deficit level under aCO2, (c) exposure to each water deficit level under eCO2, and (d) eCO2 effect within each water deficit level. Relative values (as means of three to six independent measurements) were normalized to the internal standard (ribitol) and the dry weight of the samples; false color imaging was performed on log10-transformed GC-TOF-MS metabolite data. Significant changes using one-way ANOVA are indicated as (○) for p < 0.05. Heatmaps and clustering were performed in R software [48,49] using the “gplots” package [50]. Gray-color squares represent non-detected values. Metabolites are grouped in amino acids and derivatives (AA), organic acids (OA), sugars and sugar alcohols (SS), and others (O).

