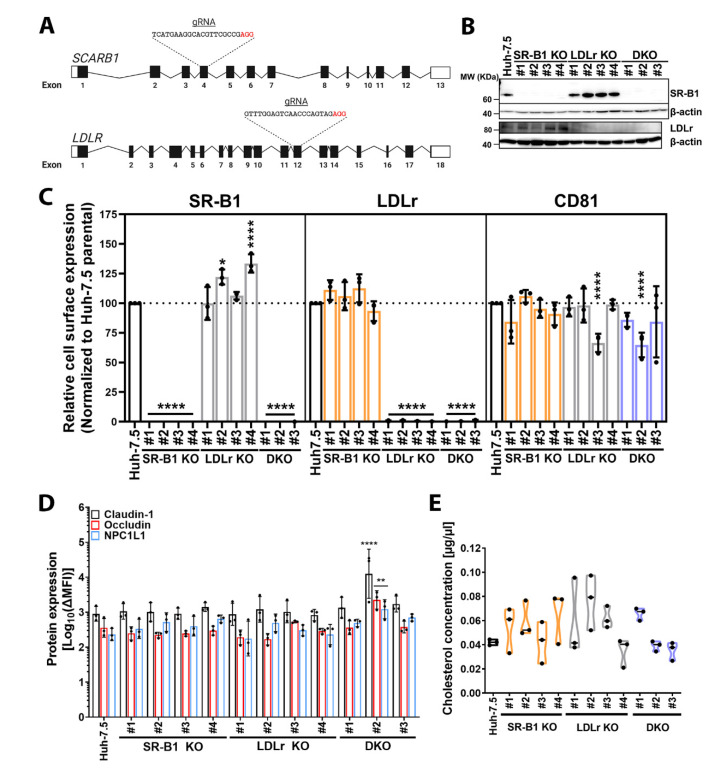
Figure 3.
Characterization of lipoprotein receptor-deficient cell lines. Lipoprotein receptor knock-out (KO) strategy and characterization. Lipoprotein receptor SCARB1 (SR-B1) and LDLR (LDLr) gene scheme (A). Graphic representation of genes for SR-B1 and LDLr. Exons are shown as boxes with black areas representing open reading frames (ORFs). Introns are shown as lines. CRISPR-Cas9 guide RNA (gRNA) nucleotide sequence targeting SCARB1 and LDLR are depicted. Protospacer adjacent motif (PAM) is highlighted in red. Image created with BioRender.com (accessed 09/04/2020). Endogenous expression of lipoprotein receptors SR-B1 and LDLr (B). Cell lysates were evaluated for expression of indicated proteins by immunoblot using abs against the specific targets. β-actin was used as an internal control (42 kDa). Cell surface expression of SR-B1, LDLr, and CD81 in SR-B1 KO clones (light orange bars), LDLr KO clones (grey bars), and DKO clones (light blue bars) (C). Saturating concentrations of fluorophore conjugates abs against cellular targets and their isotype controls were used to stain cells for 20 min at 4 °C. Stained cells were analyzed by flow cytometry and ΔMFI was calculated as stated in the methods. ΔMFI values were normalized to parental Huh-7.5 cells. Endogenous expression of HCV entry factors claudin-1, occludin, and NPC1L1 (D). Protein expression was determined by immunostaining of permeabilized cells with equal amounts of specific abs or isotype controls for 60 min at 4 °C, followed by detection of bound abs with an Alexa Fluor 488 (AF488)-conjugated secondary ab. Specific staining was determined as ΔMFI. Total cholesterol in lipoprotein receptor KOs (E). Lipids were extracted from cells as described in the methods. The cholesterol fraction was measured using a colorimetric assay and cholesterol amount extrapolated from an in-run standard curve and transformed to cholesterol concentration (µg/µL). KO cells are shown in the same color patterns as for C. Graphs C, D, and E display the average of three experiments performed in triplicate and represent individual values as black dots. SD is shown as error bars. Statistical significance of the total (D) or cell surface staining (C) was assessed by a two-way ANOVA with a Dunnett post hoc (α = 0.05, DF = 72) and with a one-way ANOVA corrected with Dunnett post hoc for the cholesterol content (α = 0.05, DF = 24) (E). Statistical significance is shown as p-value: * p ≤ 0.05; ** p ≤ 0.01; **** p ≤ 0.0001.

