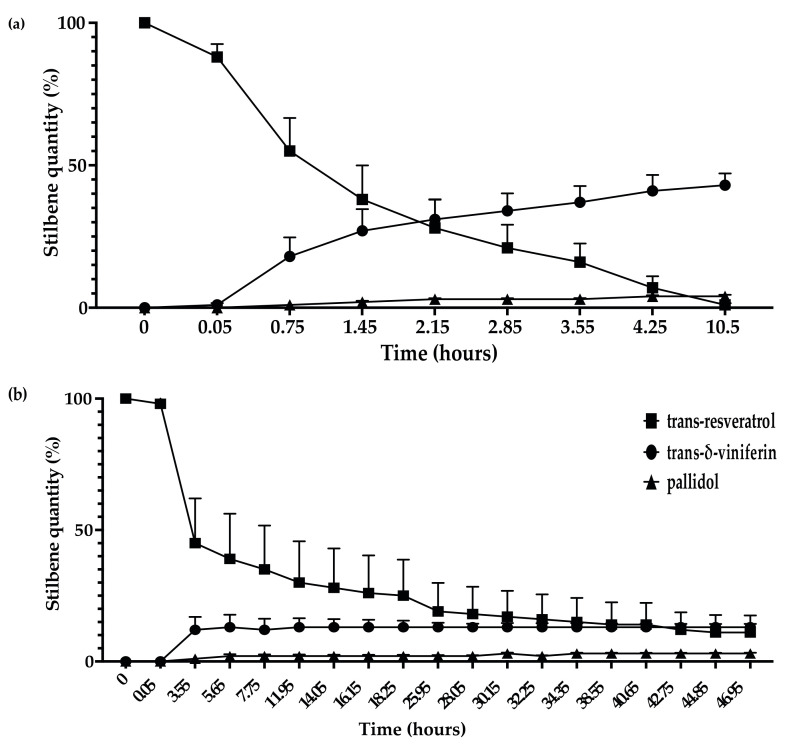
Figure 5.
Kinetics of trans-resveratrol (5 μg/mL) metabolization in sodium acetate buffer by total extracellular protein extract from (a) D. seriata (200 μg/mL) and (b) N. parvum (1 mg/mL). Evolution of trans-resveratrol quantity is represented by square dots, trans-δ-viniferin is represented by circle dots, and pallidol is represented by triangle dots. Error bars represent the standard error of the mean (SEM). Mean and SEM were calculated with three biological replicates each comprising two technical replicates (n = 6).

