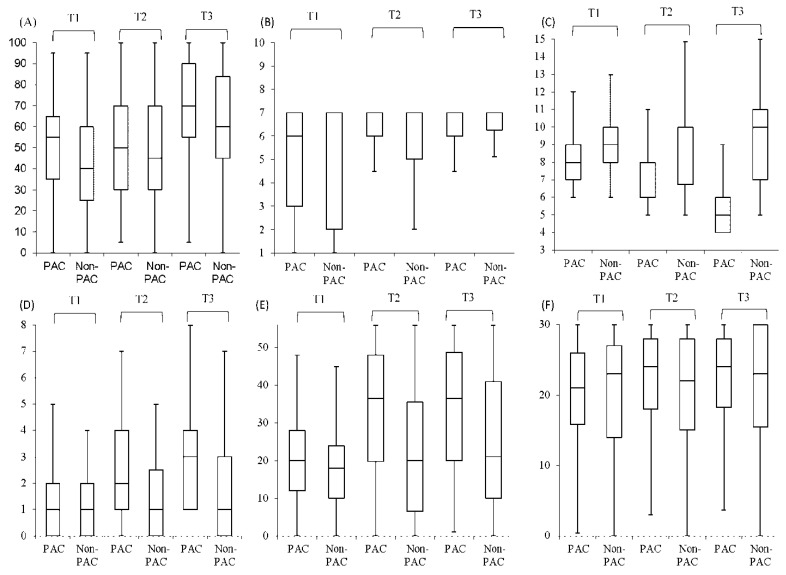
Figure 2.
Comparison of box plot of all function status measures between post-acute care (PAC) group (n = 273) and non-PAC group (n = 273) before and after rehabilitation. The box plot indicates the interquartile range; the line, the median; the error bars, 95% confidence intervals (95% CIs). (A) BI, Barthel Index (B) FOIS, Functional Oral Intake Scale (C) EQ5D, EuroQoL Quality of Life Scale (D) IADL, Instrumental Activities of Daily Living Scale (E) BBS, Berg Balance Scale (F) MMSE, Mini-mental State Examination. T1: before rehabilitation; T2: 12th week after rehabilitation; T3: 1st year after rehabilitation.

