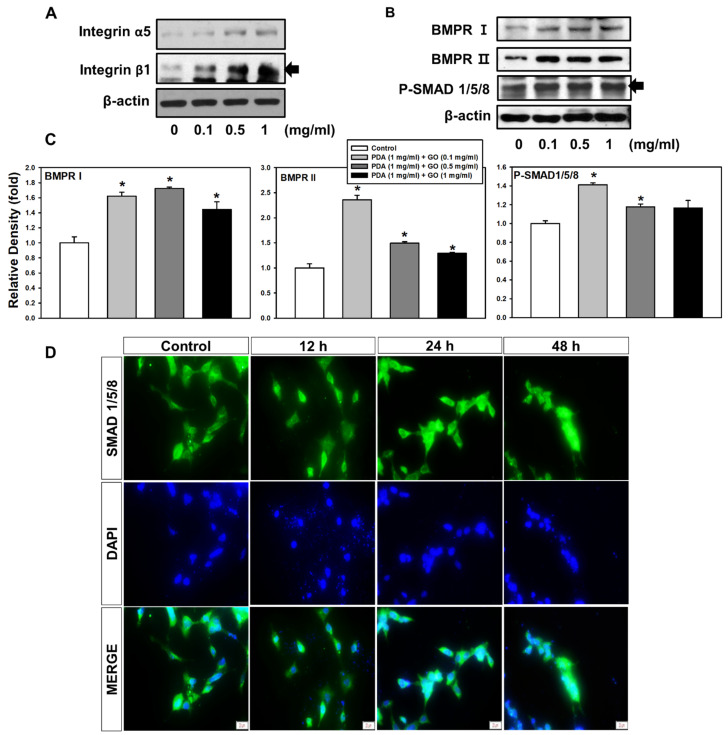
Figure 4.
Effect of PDA/GO on integrin α5/β1, MAPKs, BMPR I/II, and SMAD 1/5/8 signaling pathways. The cells were cultured on the PDA/GO substrate for 7 days, and the protein levels of (A) integrin α5 (138 kDa), integrin β1 (150 kDa), and (B) BMPR I (50–55 kDa), BMPR II (115 kDa), and phosphorylation levels of SMAD 1/5/8 (52–56 kDa) were analyzed. (C) The bars denote the density relative to β-actin. The values are expressed as means ± SD (n = 3). * p < 0.05 vs. control value. (D) Nuclear translocation of SMAD 1/5/8 was assessed by immunofluorescence staining (scale bar, 20 μm).

