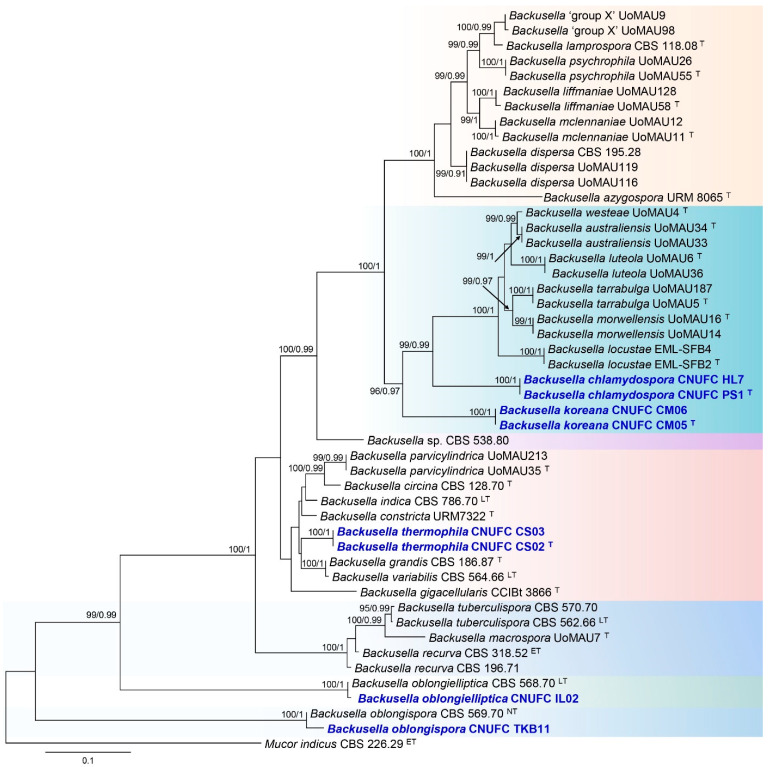
Figure 2.
Phylogenetic tree constructed by maximum likelihood analysis of 49 sequences of the combined ITS and LSU. The numbers above branches represent maximum likelihood bootstrap percentages (left) and Bayesian posterior probabilities (right). Bootstrap values ≥70% and Bayesian posterior probabilities ≥0.90 are shown. The bar indicates the number of substitutions per position. Mucor indicus CBS 226.29 was used as outgroup. Ex-type, ex-epitype, ex-lectotype, and ex-neotype strains are marked with T, ET, LT, and NT, respectively. Newly generated sequences are in bold blue.

