Figure 3.
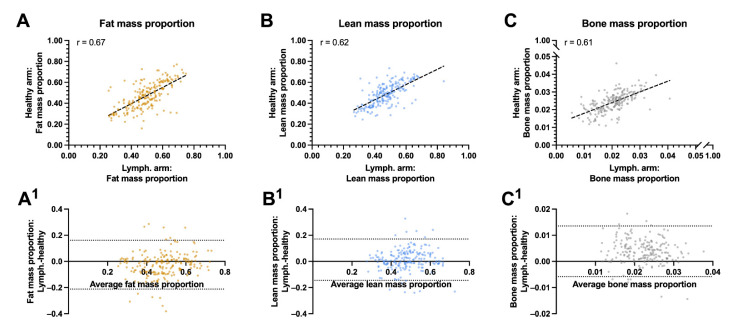
Correlation and agreement between biocomposition proportions between the lymphedema and healthy arms: This figure shows the correlation and agreement between the lymphedema and healthy arms proportion of fat, lean and bone mass. (A) Fat mass to whole arm ratio between the lymphedema and healthy arm. (A1) Agreements between the fat mass proportion of the lymphedema and healthy arm. (B) Lean mass to whole arm proportion between the lymphedema and healthy arm. (B1) Agreements between the lean mass proportion of the lymphedema and healthy arm. (C) bone mass to whole arm proportion between the lymphedema and healthy arm. (C1) Agreements between the bone mass proportion of the lymphedema and healthy arm. The whole arm proportion of lean, fat and bone mass correlated moderately between the lymphedema and healthy arm and there was a good agreement between the proportion of fat mass, lean mass and bone mass in the lymphedema and healthy arm. The striped lines shows the line of best fit in panel A, B and C. The horizontal dotted lines denote the 95% confidence intervals for the limits of agreements in panel A1, B1, and C 1. R = pearson correlation.

