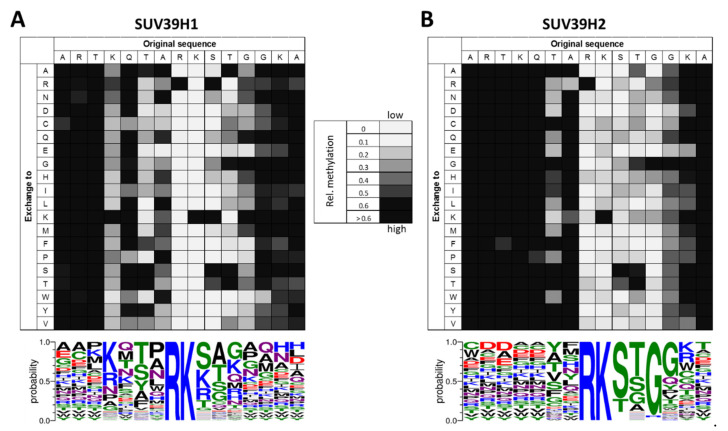
Figure 3.
Specificity profiles of SUV39H1 (A) and SUV39H2 (B). Methylation of peptide substrates containing all possible single amino acid exchanges of the H3 sequence is shown. The horizontal axis represents the sequence of the peptide and in the vertical direction the amino acid that is altered in the corresponding peptide is indicated. Activity is encoded in a grayscale as indicated in the legend. The sequence logo describing the specificity has been prepared with Weblogo3 (http://weblogo.threeplusone.com/ (accessed on 30 April 2021)) [31] and is printed below. Activity data were taken from [26,28].

