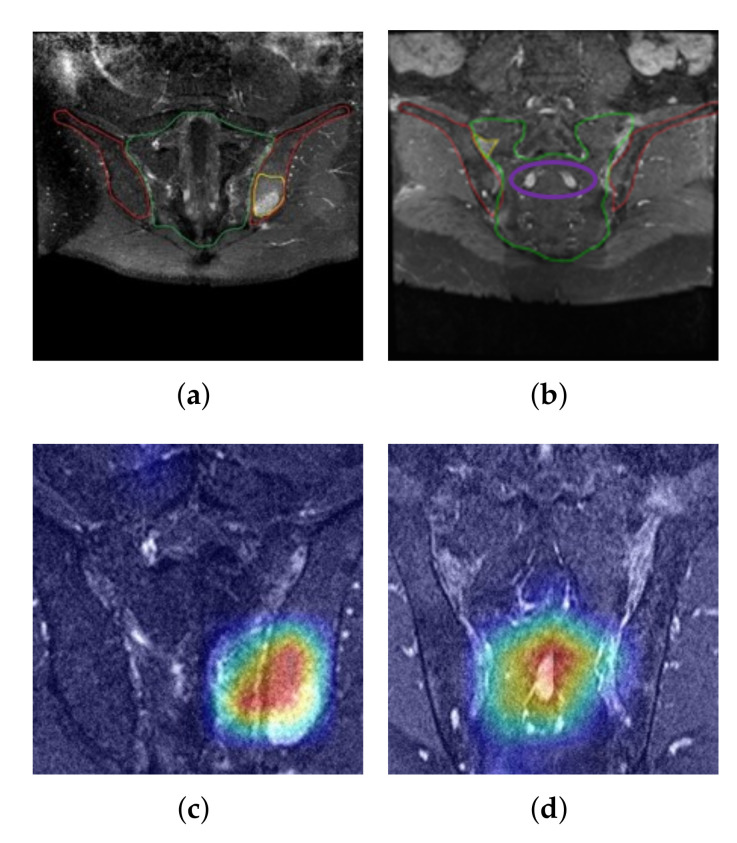
Figure 8.
(a) Results of the class activation mapping for an example image with bone marrow edema; (b) Another example of an image with markers for bone marrow edema; (c) Gradient-based class activation map of (a); (d) Gradient-based class activation map of (b). The color represents regions with the greatest activation, and the degree of activation decreases in the order of orange, yellow, green, and blue.

