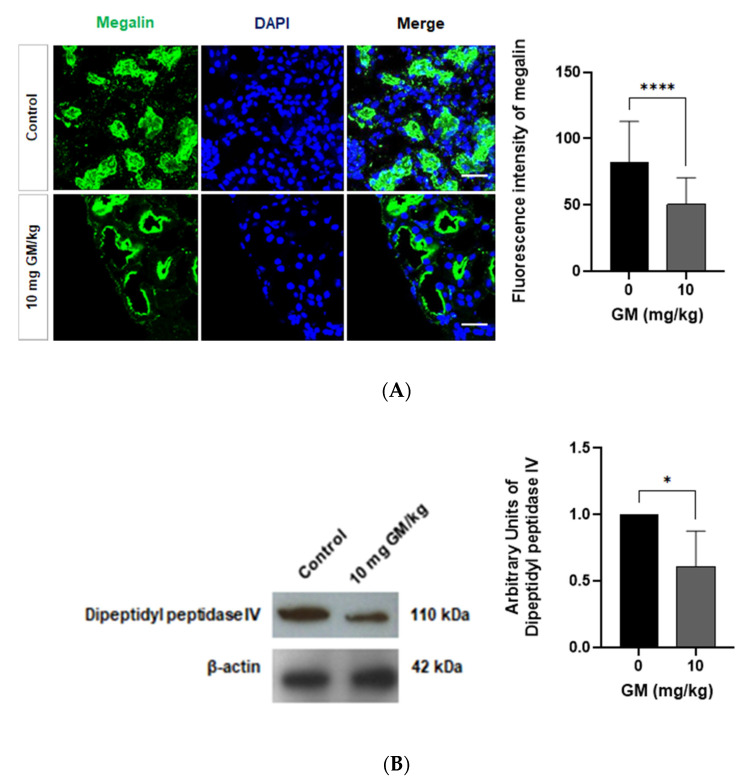
Figure 3.
The protein expression of megalin and dipeptidyl peptidase IV decreases in PT after GM administration (A) Representative micrographs showing the expression of megalin in PT from untreated mice and GM exposed mice. Nuclei are stained blue with DAPI. Scale Bar = 50 µm. Bar graph shows means ± SD of a series of images from 3 different mice. Student’s t-test, **** p < 0.0001; (B) Representative blots of dipeptidyl peptidase IV and β-actin from whole renal tissue of untreated and GM-exposed mice. Bar graph shows means ± SD. Student’s t-test, * p < 0.05. n = 5 animals per dose.

