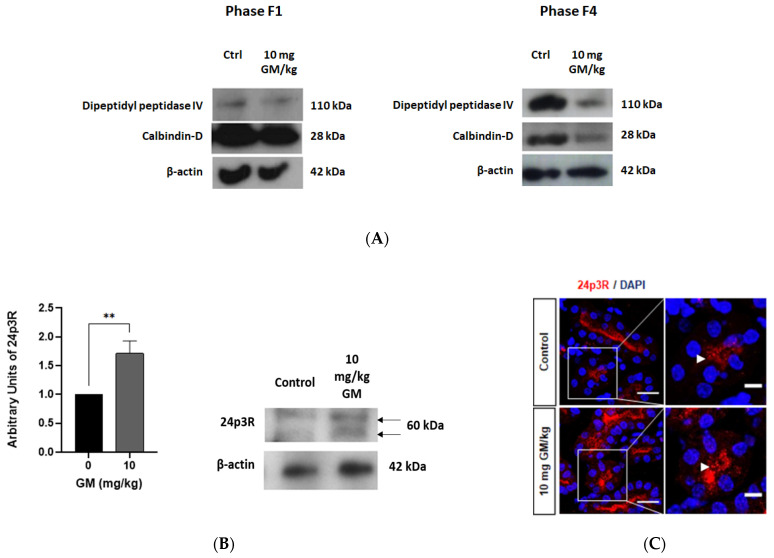
Figure 8.
GM-induced PT injury is associated with increased 24p3R expression in DT. (A) Western blots of F1 (DT enriched) and F4 fractions (PT enriched) obtained after ultracentrifugation of tubules on a Percoll gradient. Dipeptidyl peptidase IV: PT marker; Calbindin-D: DT marker; (B) Representative blots of 24p3R and β-actin in DT enriched F1 fraction of untreated and GM-exposed mice (10 mg/kg). The bar chart shows means ± SD of normalized densitometry values. Student’s t-Test was performed. ** p < 0.05. n = 3. Each experiment was performed with 10 animals to obtain a pool of DT; (C) Representative micrographs showing the expression of 24p3R in renal tissue of control and GM-treated mice. Arrows show expression of 24p3R. Nuclei are stained with DAPI (blue). Scale Bars = 50 µm (left) and 20 µm (right).

