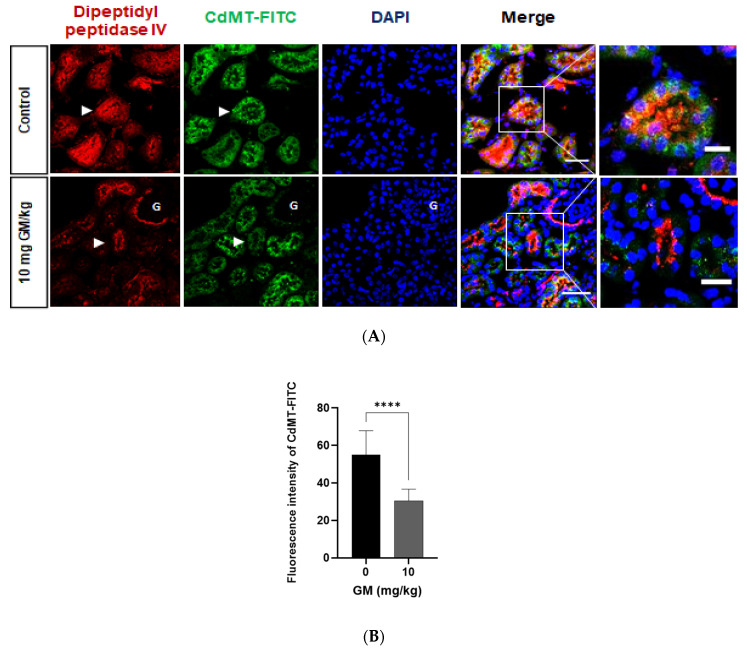
Figure 9.
Uptake of CdMT by Dipeptidyl Peptidase IV (DPPIV) positive PT cells decrease after GM administration. (A) Representative micrographs of CdMT complex immunofluorescence intensity (green) with stained DPPIV (red) and nuclei (blue DAPI). Scale Bars = 50 µm (left) and 20 µm (right). G: glomerulus. White arrowheads point at magnified tubules in the merged images of control and GM treated animals. (B) Quantification of CdMT complex immunofluorescence intensity in DPPIV positive cells (PT). The bar graph displays means ± SD of five randomized photographs per animal (three animals per group). Student’s t-test was performed, **** p < 0.0001.

