Figure 11.
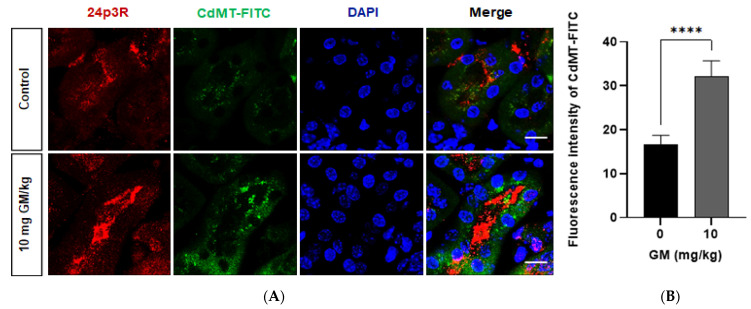
Internalization of the CdMT-FITC complex increases in renal cortex cells expressing 24p3R (DT and possibly CD) after GM exposure. (A) Representative micrographs of cells expressing 24p3R from untreated and GM-exposed mice. Nuclei are stained with DAPI (blue). Scale Bar = 50 µm; (B) Bar chart displaying means ± SD of five randomized photographs per animal (three animals per group). Quantification of CdMT complex immunofluorescence intensity (green) was performed on kidney sections stained for 24p3R (red). Student’s t-test was performed, **** p < 0.0001.

