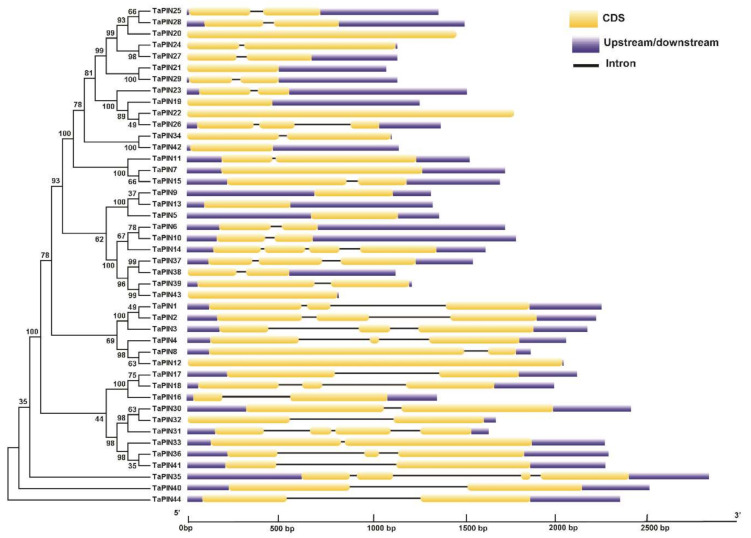
Figure 4.
Exon–intron organization of the TaPIN genes. Yellow boxes represent exons, untranslated regions (UTRs) are indicated by blue boxes, and black lines represent introns. The lengths of the boxes and lines are scaled based on gene length. The exon and intron sizes can be estimated using the scale at the bottom.

