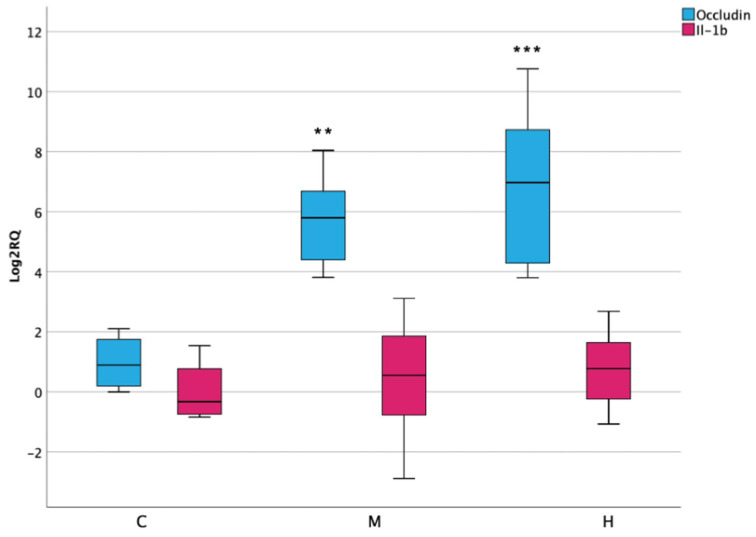
Figure 7.
Box plot showing relative expression of Il-1β in lower intestine when compared to control C1 (Log2RQ = 0) to medium treatment (M) and high treatment (H) by qPCR. RQ, relative quantification. The box plots show the median value (horizontal line), the top and bottom edges of the boxes (75% and 25% percentiles) and whiskers, which are the furthest values away from the boxes that are not considered outliers. ** p < 0.01; *** p < 0.001 significantly different from the control.

